Duke Energy 2014 Annual Report Download - page 205
Download and view the complete annual report
Please find page 205 of the 2014 Duke Energy annual report below. You can navigate through the pages in the report by either clicking on the pages listed below, or by using the keyword search tool below to find specific information within the annual report.-
 1
1 -
2
-
3
-
4
-
5
-
6
-
7
-
8
-
9
-
10
-
11
-
12
-
13
-
14
-
15
-
16
-
17
-
18
-
19
-
20
-
21
-
22
-
23
-
24
-
25
-
26
-
27
-
28
-
29
-
30
-
31
-
32
-
33
-
34
-
35
-
36
-
37
-
38
-
39
-
40
-
41
-
42
-
43
-
44
-
45
-
46
-
47
-
48
-
49
-
50
-
51
-
52
-
53
-
54
-
55
-
56
-
57
-
58
-
59
-
60
-
61
-
62
-
63
-
64
-
65
-
66
-
67
-
68
-
69
-
70
-
71
-
72
-
73
-
74
-
75
-
76
-
77
-
78
-
79
-
80
-
81
-
82
-
83
-
84
-
85
-
86
-
87
-
88
-
89
-
90
-
91
-
92
-
93
-
94
-
95
-
96
-
97
-
98
-
99
-
100
-
101
-
102
-
103
-
104
-
105
-
106
-
107
-
108
-
109
-
110
-
111
-
112
-
113
-
114
-
115
-
116
-
117
-
118
-
119
-
120
-
121
-
122
-
123
-
124
-
125
-
126
-
127
-
128
-
129
-
130
-
131
-
132
-
133
-
134
-
135
-
136
-
137
-
138
-
139
-
140
-
141
-
142
-
143
-
144
-
145
-
146
-
147
-
148
-
149
-
150
-
151
-
152
-
153
-
154
-
155
-
156
-
157
-
158
-
159
-
160
-
161
-
162
-
163
-
164
-
165
-
166
-
167
-
168
-
169
-
170
-
171
-
172
-
173
-
174
-
175
-
176
-
177
-
178
-
179
-
180
-
181
-
182
-
183
-
184
-
185
-
186
-
187
-
188
-
189
-
190
-
191
-
192
-
193
-
194
-
 195
195 -
 196
196 -
 197
197 -
 198
198 -
 199
199 -
 200
200 -
 201
201 -
 202
202 -
 203
203 -
 204
204 -
 205
205 -
 206
206 -
 207
207 -
 208
208 -
 209
209 -
 210
210 -
 211
211 -
 212
212 -
 213
213 -
 214
214 -
 215
215 -
216
-
217
-
218
-
219
-
220
-
221
-
222
-
223
-
224
-
225
-
226
-
227
-
228
-
229
-
230
-
231
-
232
-
233
-
234
-
235
-
236
-
237
-
238
-
239
-
240
-
241
-
242
-
243
-
244
-
245
-
246
-
247
-
248
-
249
-
250
-
251
-
252
-
253
-
254
-
255
-
256
-
257
-
258
-
259
-
260
-
261
-
262
-
263
-
264
 |
 |

185
PART II
DUKE ENERGY CORPORATION • DUKE ENERGY CAROLINAS, LLC • PROGRESS ENERGY, INC. •
DUKE ENERGY PROGRESS, INC. • DUKE ENERGY FLORIDA, INC. • DUKE ENERGY OHIO, INC. • DUKE ENERGY INDIANA, INC.
Combined Notes to Consolidated Financial Statements – (Continued)
20. STOCK-BASED COMPENSATION
Duke Energy’s 2010 Long-Term Incentive Plan (the 2010 Plan) reserved
25 million shares of common stock for awards to employees and outside
directors. Duke Energy has historically issued new shares upon exercising or
vesting of share-based awards. However, Duke Energy may use a combination
of new share issuances and open market repurchases for share-based
awards that are exercised or become vested in the future. Duke Energy has not
determined with certainty the amount of such new share issuances or open
market repurchases.
The 2010 Plan allows for a maximum of 6.25 million shares of common
stock to be issued under various stock-based awards other than options and
stock appreciation rights.
In connection with the acquisition of Progress Energy in July 2012, Duke
Energy assumed Progress Energy’s 2007 Equity Incentive Plan (EIP). Stock-
based awards granted under the Progress Energy EIP and held by Progress
Energy employees were generally converted into outstanding Duke Energy
stock-based compensation awards. The estimated fair value of these awards
allocated to the purchase price was $62 million. Refer to Note 2 for further
information regarding the merger transaction.
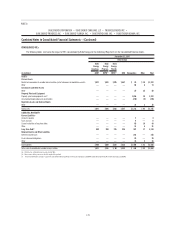
The following table summarizes the total expense recognized by each of
the Duke Energy Registrants, net of tax, for stock-based compensation.
Years Ended December 31,
(in millions) 2014 2013 2012
Duke Energy $38 $52 $48
Duke Energy Carolinas 12 13 12
Progress Energy 14 23 25
Duke Energy Progress 914 16
Duke Energy Florida 599
Duke Energy Ohio 544
Duke Energy Indiana 344
Pretax stock-based compensation costs, the tax benefi t associated with
stock-based compensation expense, and stock-based compensation costs
capitalized are included in the following table.
Years Ended December 31,
(in millions) 2014 2013 2012
Restricted stock unit awards $39 $49 $43
Performance awards 22 34 33
Stock options —22
Pretax stock-based compensation cost $61 $85 $78
Tax benefi t associated with stock-based
compensation expense $23 $33 $30
Stock-based compensation costs capitalized 432
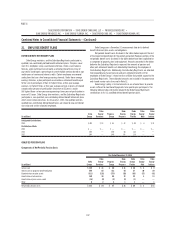
STOCK OPTIONS
The following table summarizes information about stock options
outstanding.
Options
(in thousands)
Weighted-
Average
Exercise
Price (per
share)
Weighted-
Average
Remaining
Life
Aggregate
Intrinsic
Value
(in millions)
Outstanding
at December 31, 2013 793 $ 61
Exercised (420) 59
Outstanding
at December 31, 2014 373 64 6y, 10m $ 7
Exercisable
at December 31, 2014 53 46 1y 2
Options expected to vest 320 67 7y, 10m 5
The exercise price of each option granted cannot be less than the market
price of Duke Energy’s common stock on the date of grant and the maximum
option term is 10 years. The vesting periods range from immediate to three
years. Options granted in 2013 and 2012 were expensed immediately; therefore,
there is no future compensation cost associated with these options.
The following table summarizes additional information related to stock
options exercised and granted.
Years Ended December 31,
2014 2013 2012
Intrinsic value of options exercised (in millions) $ 6 $ 26 $ 17
Tax benefi t related to options exercised (in millions) 210 7
Cash received from options exercised (in millions) 25 921
Stock options granted (in thousands) —310 340
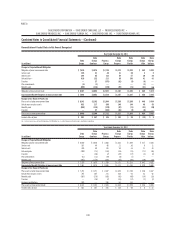
RESTRICTED STOCK UNIT AWARDS
Restricted stock unit awards issued and outstanding generally vest over
periods from immediate to 3 years. Fair value amounts are based on the market
price of Duke Energy’s common stock at the grant date. The following table
includes information related to restricted stock unit awards.
Years Ended December 31,
2014 2013 2012
Shares awarded (in thousands) 557 612 443
Fair value (in millions) $40 $42 $28