Duke Energy 2014 Annual Report Download - page 56
Download and view the complete annual report
Please find page 56 of the 2014 Duke Energy annual report below. You can navigate through the pages in the report by either clicking on the pages listed below, or by using the keyword search tool below to find specific information within the annual report.-
 1
1 -
2
-
3
-
4
-
5
-
6
-
7
-
8
-
9
-
10
-
11
-
12
-
13
-
14
-
15
-
16
-
17
-
18
-
19
-
20
-
21
-
22
-
23
-
24
-
25
-
26
-
27
-
28
-
29
-
30
-
31
-
32
-
33
-
34
-
35
-
36
-
37
-
38
-
39
-
40
-
41
-
42
-
43
-
44
-
45
-
 46
46 -
 47
47 -
 48
48 -
 49
49 -
 50
50 -
 51
51 -
 52
52 -
 53
53 -
 54
54 -
 55
55 -
 56
56 -
 57
57 -
 58
58 -
 59
59 -
 60
60 -
 61
61 -
 62
62 -
 63
63 -
 64
64 -
 65
65 -
 66
66 -
67
-
68
-
69
-
70
-
71
-
72
-
73
-
74
-
75
-
76
-
77
-
78
-
79
-
80
-
81
-
82
-
83
-
84
-
85
-
86
-
87
-
88
-
89
-
90
-
91
-
92
-
93
-
94
-
95
-
96
-
97
-
98
-
99
-
100
-
101
-
102
-
103
-
104
-
105
-
106
-
107
-
108
-
109
-
110
-
111
-
112
-
113
-
114
-
115
-
116
-
117
-
118
-
119
-
120
-
121
-
122
-
123
-
124
-
125
-
126
-
127
-
128
-
129
-
130
-
131
-
132
-
133
-
134
-
135
-
136
-
137
-
138
-
139
-
140
-
141
-
142
-
143
-
144
-
145
-
146
-
147
-
148
-
149
-
150
-
151
-
152
-
153
-
154
-
155
-
156
-
157
-
158
-
159
-
160
-
161
-
162
-
163
-
164
-
165
-
166
-
167
-
168
-
169
-
170
-
171
-
172
-
173
-
174
-
175
-
176
-
177
-
178
-
179
-
180
-
181
-
182
-
183
-
184
-
185
-
186
-
187
-
188
-
189
-
190
-
191
-
192
-
193
-
194
-
195
-
196
-
197
-
198
-
199
-
200
-
201
-
202
-
203
-
204
-
205
-
206
-
207
-
208
-
209
-
210
-
211
-
212
-
213
-
214
-
215
-
216
-
217
-
218
-
219
-
220
-
221
-
222
-
223
-
224
-
225
-
226
-
227
-
228
-
229
-
230
-
231
-
232
-
233
-
234
-
235
-
236
-
237
-
238
-
239
-
240
-
241
-
242
-
243
-
244
-
245
-
246
-
247
-
248
-
249
-
250
-
251
-
252
-
253
-
254
-
255
-
256
-
257
-
258
-
259
-
260
-
261
-
262
-
263
-
264
 |
 |

36
PART II
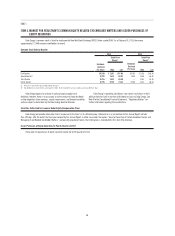
Operating Revenues. The variance was driven primarily by:
• A $67 million decrease in Brazil due to weakening of the Real to the U.S.
dollar,
• A $53 million decrease in Central America due to lower average prices
and volumes, and
• An $18 million decrease in Argentina as a result of unfavorable
exchange rates.
Partially offset by:
• A $67 million increase in Brazil due to higher average prices, net of
lower volumes, and
• A $65 million increase in Chile as a result of asset acquisitions in 2012.
Operating Expenses. The variance was driven primarily by:
• A $65 million decrease in Central America due to lower fuel costs,
partially offset by higher purchased power and coal consumption, and
• A $20 million decrease in Brazil due to weakening of the Real to the
U.S. dollar and lower purchased power partially offset by higher variable
costs.
Partially offset by:
• A $36 million increase in Chile as a result of acquisitions in 2012.
Other Income and Expenses, net. The decrease was primarily driven
by a net currency remeasurement loss in Latin America due to strengthening of
the dollar, and lower equity earnings at NMC as a result of lower MTBE average
prices and lower volumes due to extended maintenance, partially offset by lower
butane costs.
Interest Expense. The variance was primarily due to the Chile
acquisitions in 2012, partially offset by favorable exchange rates and lower
infl ation in Brazil.
Income Tax Expense. The variance was primarily due to a decrease in
pretax income. The effective tax rates for the years ended December 31, 2013
and 2012 were 28.3 percent and 24.8 percent, respectively. The increase in the
effective tax rate is primarily due to a higher proportion of earnings in countries
with higher tax rates.
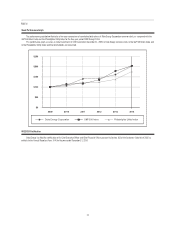
Matters Impacting Future International Energy Results
International Energy’s operations include conventional hydroelectric power
generation facilities located in Brazil where water reservoirs are currently at
abnormally low levels due to a lack of rainfall. In addition, International Energy’s
equity earnings from NMC refl ect sales of methanol and MTBEs, which generates
margins that are directionally correlated with crude oil prices. International
Energy’s earnings and future cash fl ows could be adversely impacted by either
a sustained period of low reservoir levels, especially if the government of Brazil
were to implement rationing or some other mandatory conservation program, or
a signifi cant decrease in crude oil prices.
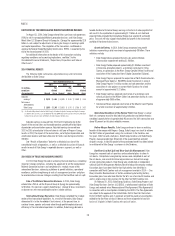
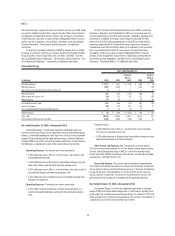
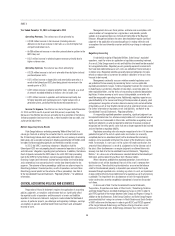
Commercial Power
Years Ended December 31,
(in millions) 2014 2013
Variance
2014 vs.
2013 2012
Variance
2013 vs.
2012
Operating Revenues $ 255 $ 260 $ (5) $ 307 $ (47)
Operating Expenses 441 425 16 419 6
(Losses) Gains on Sales of Other Assets and Other, net —(23) 23 2 (25)
Operating Loss (186) (188) 2 (110) (78)
Other Income and Expense, net 18 13 5 33 (20)
Interest Expense 58 61 (3) 63 (2)
Loss Before Income Taxes (226) (236) 10 (140) (96)
Income Tax Benefi t (171) (148) (23) (82) (66)
Less: Income Attributable to Noncontrolling Interests ——— 1 (1)
Segment Loss $ (55) $ (88) $ 33 $ (59) $ (29)
Coal-fi red plant production, GWh 867 1,644 (777) 2,096 (452)
Renewable plant production, GWh 5,462 5,111 351 3,452 1,659
Total Commercial Power production, GWh 6,329 6,755 (426) 5,548 1,207
Net proportional MW capacity in operation 1,370 2,031 (661) 2,222 (191)
Year Ended December 31, 2014 as Compared to 2013
Commercial Power’s results were impacted by higher production
tax credits generation, higher production and lower operating costs by the
renewables business and a prior-year loss recognized on certain renewables
projects, partially offset by an impairment recorded for an intangible asset. The
following is a detailed discussion of the variance drivers by line item.
Operating Revenues. The variance was driven primarily by:
• An $8 million decrease in electric revenues for the Beckjord station,
which is not included in the Disposal Group, driven from lower
production as units have been retired; and
• A $7 million decrease in net mark-to-market revenues on non-qualifying
power hedge contracts.
Partially offset by:
• A $16 million increase in electric revenues from higher production in the
renewables portfolio.
Operating Expenses. The variance was driven primarily by:
• A $94 million increase driven by an impairment taken related to Ohio
Valley Electric Corporation (OVEC). See Note 11 to the Consolidated
Financial Statements, “Goodwill and Intangible Assets” for additional
information.