Duke Energy 2014 Annual Report Download - page 169
Download and view the complete annual report
Please find page 169 of the 2014 Duke Energy annual report below. You can navigate through the pages in the report by either clicking on the pages listed below, or by using the keyword search tool below to find specific information within the annual report.-
 1
1 -
2
-
3
-
4
-
5
-
6
-
7
-
8
-
9
-
10
-
11
-
12
-
13
-
14
-
15
-
16
-
17
-
18
-
19
-
20
-
21
-
22
-
23
-
24
-
25
-
26
-
27
-
28
-
29
-
30
-
31
-
32
-
33
-
34
-
35
-
36
-
37
-
38
-
39
-
40
-
41
-
42
-
43
-
44
-
45
-
46
-
47
-
48
-
49
-
50
-
51
-
52
-
53
-
54
-
55
-
56
-
57
-
58
-
59
-
60
-
61
-
62
-
63
-
64
-
65
-
66
-
67
-
68
-
69
-
70
-
71
-
72
-
73
-
74
-
75
-
76
-
77
-
78
-
79
-
80
-
81
-
82
-
83
-
84
-
85
-
86
-
87
-
88
-
89
-
90
-
91
-
92
-
93
-
94
-
95
-
96
-
97
-
98
-
99
-
100
-
101
-
102
-
103
-
104
-
105
-
106
-
107
-
108
-
109
-
110
-
111
-
112
-
113
-
114
-
115
-
116
-
117
-
118
-
119
-
120
-
121
-
122
-
123
-
124
-
125
-
126
-
127
-
128
-
129
-
130
-
131
-
132
-
133
-
134
-
135
-
136
-
137
-
138
-
139
-
140
-
141
-
142
-
143
-
144
-
145
-
146
-
147
-
148
-
149
-
150
-
151
-
152
-
153
-
154
-
155
-
156
-
157
-
158
-
 159
159 -
 160
160 -
 161
161 -
 162
162 -
 163
163 -
 164
164 -
 165
165 -
 166
166 -
 167
167 -
 168
168 -
 169
169 -
 170
170 -
 171
171 -
 172
172 -
 173
173 -
 174
174 -
 175
175 -
 176
176 -
 177
177 -
 178
178 -
 179
179 -
180
-
181
-
182
-
183
-
184
-
185
-
186
-
187
-
188
-
189
-
190
-
191
-
192
-
193
-
194
-
195
-
196
-
197
-
198
-
199
-
200
-
201
-
202
-
203
-
204
-
205
-
206
-
207
-
208
-
209
-
210
-
211
-
212
-
213
-
214
-
215
-
216
-
217
-
218
-
219
-
220
-
221
-
222
-
223
-
224
-
225
-
226
-
227
-
228
-
229
-
230
-
231
-
232
-
233
-
234
-
235
-
236
-
237
-
238
-
239
-
240
-
241
-
242
-
243
-
244
-
245
-
246
-
247
-
248
-
249
-
250
-
251
-
252
-
253
-
254
-
255
-
256
-
257
-
258
-
259
-
260
-
261
-
262
-
263
-
264
 |
 |

149
PART II
DUKE ENERGY CORPORATION • DUKE ENERGY CAROLINAS, LLC • PROGRESS ENERGY, INC. •
DUKE ENERGY PROGRESS, INC. • DUKE ENERGY FLORIDA, INC. • DUKE ENERGY OHIO, INC. • DUKE ENERGY INDIANA, INC.
Combined Notes to Consolidated Financial Statements – (Continued)
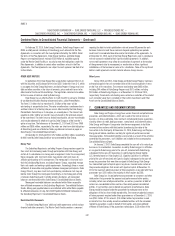
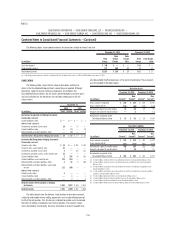
11. GOODWILL AND INTANGIBLE ASSETS
GOODWILL
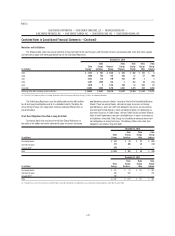
The following tables present goodwill by reportable operating segment for
Duke Energy and Duke Energy Ohio.
Duke Energy
(in millions)
Regulated
Utilities
International
Energy
Commercial
Power Total
Balance at December 31, 2013
Goodwill $ 15,950 $ 326 $ 935 $17,211
Accumulated impairment charges — — (871) (871)
Balance at December 31, 2013,
net of accumulated impairment
charges 15,950 326 64 16,340
Foreign exchange and other changes — (19) — (19)
Balance at December 31, 2014
Goodwill 15,950 307 935 17,192
Accumulated impairment charges — — (871) (871)
Balance at December 31, 2014,
net of accumulated impairment
charges $ 15,950 $ 307 $ 64 $16,321
Duke Energy Ohio
(in millions)
Regulated
Utilities
Commercial
Power Total
Balance at December 31, 2013
Goodwill $1,136 $ 1,188 $ 2,324
Accumulated impairment charges (216) (1,188) (1,404)
Balance at December 31, 2013, net of
accumulated impairment charges 920 — 920
Balance at December 31, 2014
Goodwill 1,136 1,188 2,324
Accumulated impairment charges (216) (1,188) (1,404)
Balance at December 31, 2014,
net of accumulated impairment charges $ 920 $ — $ 920
Progress Energy
Progress Energy’s Goodwill is included in the Regulated Utilities operating
segment and there are no accumulated impairment charges.
Impairment Testing
Duke Energy, Duke Energy Ohio and Progress Energy are required to
perform an annual goodwill impairment test as of the same date each year and,
accordingly, performs its annual impairment testing of goodwill as of August 31.
Duke Energy, Duke Energy Ohio and Progress Energy update their test between
annual tests if events or circumstances occur that would more likely than not
reduce the fair value of a reporting unit below its carrying value. As the fair
value of Duke Energy, Duke Energy Ohio and Progress Energy’s reporting units
exceeded their respective carrying values at the date of the annual impairment
analysis, no impairment charges were recorded in 2014.
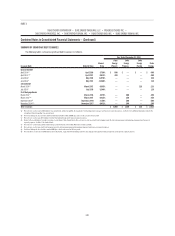
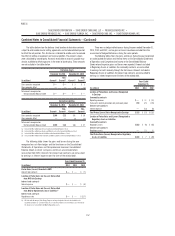
INTANGIBLE ASSETS
The following tables show the carrying amount and accumulated amortization of intangible assets within Other on the Consolidated Balance Sheets of the Duke
Energy Registrants at December 31, 2014 and 2013.
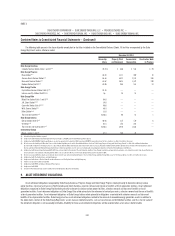
December 31, 2014
(in millions)
Duke
Energy
Duke
Energy
Carolinas
Progress
Energy
Duke
Energy
Progress
Duke
Energy
Florida
Duke
Energy
Ohio(a)
Duke
Energy
Indiana
Emission allowances $23 $1 $7 $3 $4 $— $16
Renewable energy certifi cates 97 25 69 69 — 3 —
Gas, coal and power contracts 24 — — — — — 24
Wind development rights 97 — — — — — —
Other 76 — — — — — —
Total gross carrying amounts 317 26 76 72 4 3 40
Accumulated amortization – gas, coal and power contracts (15) — — — — — (15)
Accumulated amortization – wind development rights (14) — — — — — —
Accumulated amortization – other (25) — — — — — —
Total accumulated amortization (54) — — — — — (15)
Total intangible assets, net $ 263 $26 $76 $72 $ 4 $ 3 $ 25
(a) During 2014, Duke Energy Ohio reduced the carrying amount of OVEC to zero. A charge of $94 million is recorded in Impairment Charges on Duke Energy Ohio’s Consolidated Statement of Operations. In addition, Duke Energy
Ohio has emission allowances and renewable energy certifi cates that have been reclassifi ed to Assets Held For Sale pending the sale of the Disposal Group. See Note 17 for further information.