Duke Energy 2014 Annual Report Download - page 221
Download and view the complete annual report
Please find page 221 of the 2014 Duke Energy annual report below. You can navigate through the pages in the report by either clicking on the pages listed below, or by using the keyword search tool below to find specific information within the annual report.-
 1
1 -
2
-
3
-
4
-
5
-
6
-
7
-
8
-
9
-
10
-
11
-
12
-
13
-
14
-
15
-
16
-
17
-
18
-
19
-
20
-
21
-
22
-
23
-
24
-
25
-
26
-
27
-
28
-
29
-
30
-
31
-
32
-
33
-
34
-
35
-
36
-
37
-
38
-
39
-
40
-
41
-
42
-
43
-
44
-
45
-
46
-
47
-
48
-
49
-
50
-
51
-
52
-
53
-
54
-
55
-
56
-
57
-
58
-
59
-
60
-
61
-
62
-
63
-
64
-
65
-
66
-
67
-
68
-
69
-
70
-
71
-
72
-
73
-
74
-
75
-
76
-
77
-
78
-
79
-
80
-
81
-
82
-
83
-
84
-
85
-
86
-
87
-
88
-
89
-
90
-
91
-
92
-
93
-
94
-
95
-
96
-
97
-
98
-
99
-
100
-
101
-
102
-
103
-
104
-
105
-
106
-
107
-
108
-
109
-
110
-
111
-
112
-
113
-
114
-
115
-
116
-
117
-
118
-
119
-
120
-
121
-
122
-
123
-
124
-
125
-
126
-
127
-
128
-
129
-
130
-
131
-
132
-
133
-
134
-
135
-
136
-
137
-
138
-
139
-
140
-
141
-
142
-
143
-
144
-
145
-
146
-
147
-
148
-
149
-
150
-
151
-
152
-
153
-
154
-
155
-
156
-
157
-
158
-
159
-
160
-
161
-
162
-
163
-
164
-
165
-
166
-
167
-
168
-
169
-
170
-
171
-
172
-
173
-
174
-
175
-
176
-
177
-
178
-
179
-
180
-
181
-
182
-
183
-
184
-
185
-
186
-
187
-
188
-
189
-
190
-
191
-
192
-
193
-
194
-
195
-
196
-
197
-
198
-
199
-
200
-
201
-
202
-
203
-
204
-
205
-
206
-
207
-
208
-
209
-
210
-
 211
211 -
 212
212 -
 213
213 -
 214
214 -
 215
215 -
 216
216 -
 217
217 -
 218
218 -
 219
219 -
 220
220 -
 221
221 -
 222
222 -
 223
223 -
 224
224 -
 225
225 -
 226
226 -
 227
227 -
 228
228 -
 229
229 -
 230
230 -
 231
231 -
232
-
233
-
234
-
235
-
236
-
237
-
238
-
239
-
240
-
241
-
242
-
243
-
244
-
245
-
246
-
247
-
248
-
249
-
250
-
251
-
252
-
253
-
254
-
255
-
256
-
257
-
258
-
259
-
260
-
261
-
262
-
263
-
264
 |
 |

201
PART II
DUKE ENERGY CORPORATION • DUKE ENERGY CAROLINAS, LLC • PROGRESS ENERGY, INC. •
DUKE ENERGY PROGRESS, INC. • DUKE ENERGY FLORIDA, INC. • DUKE ENERGY OHIO, INC. • DUKE ENERGY INDIANA, INC.
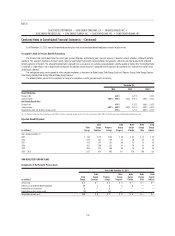
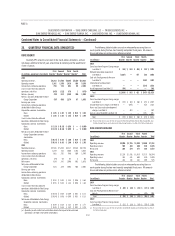
Combined Notes to Consolidated Financial Statements – (Continued)
Fair Value Measurements
Duke Energy classifi es recurring and non-recurring fair value
measurements based on the fair value hierarchy as discussed in Note 16.
Valuation methods of the primary fair value measurements disclosed
above are as follows:
Investments in equity securities
Investments in equity securities, other than those accounted for as equity
and cost method investments, are typically valued at the closing price in the
principal active market as of the last business day of the reporting period. Principal
active markets for equity prices include published exchanges such as NASDAQ
and NYSE. Foreign equity prices are translated from their trading currency using
the currency exchange rate in effect at the close of the principal active market.
Prices have not been adjusted to refl ect after-hours market activity. The majority
of investments in equity securities are valued using Level 1 measurements. When
(i) the Duke Energy Registrants lack the ability to redeem investments valued on
a net asset value per share basis in the near future or (ii) net asset value per
share is not available at the measurement date, the fair value measurement of the
investment is categorized as Level 3.
Investments in debt securities
Most debt investments are valued based on a calculation using interest
rate curves and credit spreads applied to the terms of the debt instrument
(maturity and coupon interest rate) and consider the counterparty credit rating.
Most debt valuations are Level 2 measurements. If the market for a particular
fi xed income security is relatively inactive or illiquid, the measurement is
Level 3. U.S. Treasury debt is typically Level 2.
Investments in short-term investment funds
Investments in short-term investment funds are valued at the net
asset value of units held at year end. Investments in short-term investment
funds with published prices are valued as Level 1. Investments in short-term
investment funds with unpublished prices are valued as Level 2.
Investments in real estate limited partnerships
Investments in real estate limited partnerships are valued by the trustee
at each valuation date (monthly). As part of the trustee’s valuation process,
properties are externally appraised generally on an annual basis, conducted
by reputable, independent appraisal fi rms, and signed by appraisers that are
members of the Appraisal Institute, with the professional designation MAI. Fair
value is defi ned as the price that would be received to sell an asset or paid to
transfer a liability in an orderly transaction between market participants at the
measurement date. There are three valuation techniques that can be used to
value investments in real estate assets: the market, income or cost approach.
The appropriateness of each valuation technique depends on the type of
asset or business being valued. In addition, the trustee may cause additional
appraisals to be performed as warranted by specifi c asset or market conditions.
Property valuations and the salient valuation-sensitive assumptions of each
direct investment property are reviewed by the trustee quarterly and values
are adjusted if there has been a signifi cant change in circumstances related to
the investment property since the last valuation. Value adjustments for interim
capital expenditures are only recognized to the extent that the valuation process
acknowledges a corresponding increase in fair value. An independent fi rm is
hired to review and approve quarterly direct real estate valuations. Key inputs
and assumptions used to determine fair value includes among others, rental
revenue and expense amounts and related revenue and expense growth rates,
terminal capitalization rates and discount rates. Development investments
are valued using cost incurred to date as a primary input until substantive
progress is achieved in terms of mitigating construction and leasing risk at
which point a discounted cash fl ow approach is more heavily weighted. Key
inputs and assumptions in addition to those noted above used to determine
the fair value of development investments include construction costs, and the
status of construction completion and leasing. Investments in real estate limited
partnerships are valued as Level 3.
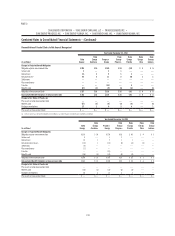
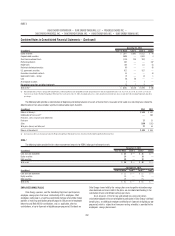
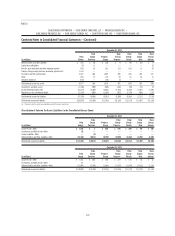
Duke Energy Master Retirement Trust
The following tables provide the fair value measurement amounts for the Duke Energy Master Retirement Trust qualifi ed pension and other post-retirement assets.
December 31, 2014
(in millions) Total Fair Value Level 1 Level 2 Level 3
Equity securities $2,346 $1,625 $ 721 $ —
Corporate debt securities 4,349 — 4,348 1
Short-term investment funds 333 171 162 —
Partnership interests 298 — — 298
Hedge funds 146 — 146 —
Real estate limited partnerships 104 — — 104
U.S. government securities 917 — 916 1
Guaranteed investment contracts 32 — — 32
Governments bonds – foreign 44 — 44 —
Cash 30 30 — —
Government and commercial mortgage backed securities 9— 9—
Net pending transactions and other investments 10 (10) 20 —
Total assets(a) $8,618 $1,816 $6,366 $436
(a) Duke Energy Carolinas, Progress Energy, Duke Energy Progress, Duke Energy Florida, Duke Energy Ohio and Duke Energy Indiana were allocated approximately 28 percent, 31 percent, 15 percent, 16 percent, 5 percent and 8
percent, respectively, of the Duke Energy Master Retirement Trust assets at December 31, 2014. Accordingly, all Level 1, 2 and 3 amounts included in the table above are allocable to the Subsidiary Registrants using these
percentages.