Duke Energy 2014 Annual Report Download - page 51
Download and view the complete annual report
Please find page 51 of the 2014 Duke Energy annual report below. You can navigate through the pages in the report by either clicking on the pages listed below, or by using the keyword search tool below to find specific information within the annual report.-
 1
1 -
2
-
3
-
4
-
5
-
6
-
7
-
8
-
9
-
10
-
11
-
12
-
13
-
14
-
15
-
16
-
17
-
18
-
19
-
20
-
21
-
22
-
23
-
24
-
25
-
26
-
27
-
28
-
29
-
30
-
31
-
32
-
33
-
34
-
35
-
36
-
37
-
38
-
39
-
40
-
 41
41 -
 42
42 -
 43
43 -
 44
44 -
 45
45 -
 46
46 -
 47
47 -
 48
48 -
 49
49 -
 50
50 -
 51
51 -
 52
52 -
 53
53 -
 54
54 -
 55
55 -
 56
56 -
 57
57 -
 58
58 -
 59
59 -
 60
60 -
 61
61 -
62
-
63
-
64
-
65
-
66
-
67
-
68
-
69
-
70
-
71
-
72
-
73
-
74
-
75
-
76
-
77
-
78
-
79
-
80
-
81
-
82
-
83
-
84
-
85
-
86
-
87
-
88
-
89
-
90
-
91
-
92
-
93
-
94
-
95
-
96
-
97
-
98
-
99
-
100
-
101
-
102
-
103
-
104
-
105
-
106
-
107
-
108
-
109
-
110
-
111
-
112
-
113
-
114
-
115
-
116
-
117
-
118
-
119
-
120
-
121
-
122
-
123
-
124
-
125
-
126
-
127
-
128
-
129
-
130
-
131
-
132
-
133
-
134
-
135
-
136
-
137
-
138
-
139
-
140
-
141
-
142
-
143
-
144
-
145
-
146
-
147
-
148
-
149
-
150
-
151
-
152
-
153
-
154
-
155
-
156
-
157
-
158
-
159
-
160
-
161
-
162
-
163
-
164
-
165
-
166
-
167
-
168
-
169
-
170
-
171
-
172
-
173
-
174
-
175
-
176
-
177
-
178
-
179
-
180
-
181
-
182
-
183
-
184
-
185
-
186
-
187
-
188
-
189
-
190
-
191
-
192
-
193
-
194
-
195
-
196
-
197
-
198
-
199
-
200
-
201
-
202
-
203
-
204
-
205
-
206
-
207
-
208
-
209
-
210
-
211
-
212
-
213
-
214
-
215
-
216
-
217
-
218
-
219
-
220
-
221
-
222
-
223
-
224
-
225
-
226
-
227
-
228
-
229
-
230
-
231
-
232
-
233
-
234
-
235
-
236
-
237
-
238
-
239
-
240
-
241
-
242
-
243
-
244
-
245
-
246
-
247
-
248
-
249
-
250
-
251
-
252
-
253
-
254
-
255
-
256
-
257
-
258
-
259
-
260
-
261
-
262
-
263
-
264
 |
 |

31
PART II
used as a basis for employee incentive bonuses. The most directly comparable
GAAP measures for adjusted earnings and adjusted diluted EPS are Net Income
Attributable to Duke Energy Corporation and Diluted EPS Attributable to Duke
Energy Corporation common shareholders, which include the dollar and per
share impact of special items, mark-to-market impacts of economic hedges in
the Commercial Power segment and discontinued operations.
Management evaluates segment performance based on segment income.
Segment income is defi ned as income from continuing operations net of income
(loss) attributable to noncontrolling interests. Segment income, as discussed
below, includes intercompany revenues and expenses that are eliminated in the
Consolidated Financial Statements. Management also uses adjusted segment
income as a measure of historical and anticipated future segment performance.
Adjusted segment income is a non-GAAP fi nancial measure, as it is based
upon segment income adjusted for the mark-to-market impacts of economic
hedges in the Commercial Power segment and special items. Management
believes the presentation of adjusted segment income as presented provides
useful information to investors, as it provides them with an additional relevant
comparison of a segment’s performance across periods. The most directly
comparable GAAP measure for adjusted segment income is segment income,
which represents segment income from continuing operations, including any
special items and the mark-to-market impacts of economic hedges in the
Commercial Power segment.
Duke Energy’s adjusted earnings, adjusted diluted EPS, and adjusted
segment income may not be comparable to similarly titled measures of another
company because other entities may not calculate the measures in the same
manner.
See Note 3 to the Consolidated Financial Statements, “Business
Segments,” for a discussion of Duke Energy’s segment structure.
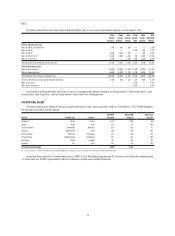
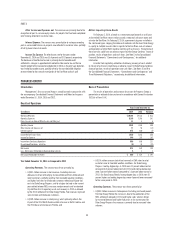
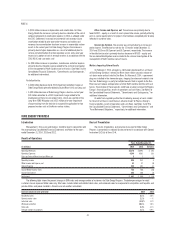
OVERVIEW
The following table reconciles non-GAAP measures to the most directly comparable GAAP measure.
Year Ended December 31, 2014
(in millions, except per share amounts)
Regulated
Utilities
International
Energy
Commercial
Power
Total
Reportable
Segments Other
Eliminations/
Discontinued
Operations
Duke
Energy
Per
Diluted
Share
Adjusted segment income/Adjusted earnings $2,897 $ 428 $ 109 $3,434 $(216) $ — $3,218 $ 4.55
International tax adjustment — (373) — (373) — — (373) (0.53)
Costs to achieve Progress Energy merger — — — — (127) — (127) (0.18)
Midwest generation operations — — (114) (114) — 114 — —
Coal ash Plea Agreements reserve (102) — — (102) — — (102) (0.14)
Asset impairment —— (59) (59) — — (59) (0.08)
Asset sales ——
— — 9 — 9 0.01
Economic hedges (mark-to-market) —
— (6) (6) — — (6) (0.01)
Discontinued operations — — 15 15 — (692) (677) (0.96)
Segment income (loss)/Net Income
Attributable to Duke Energy Corporation $2,795 $ 55 $ (55) $2,795 $(334) $(578) $1,883 $ 2.66
Year Ended December 31, 2013
(in millions, except per share amounts)
Regulated
Utilities
International
Energy
Commercial
Power
Total
Reportable
Segments Other
Eliminations/
Discontinued
Operations
Duke
Energy
Per
Diluted
Share
Adjusted segment income/Adjusted earnings $2,776 $ 408 $ 15 $3,199 $ (119) $ — $3,080 $ 4.36
Crystal River Unit 3 charges (215) — — (215) — — (215) (0.31)
Costs to achieve Progress Energy merger — — — — (184) — (184) (0.26)
Midwest generation operations — — (88) (88) 14 74 — —
Nuclear development charges (57) — — (57) — — (57) (0.08)
Litigation reserve ——
— — (14) — (14) (0.02)
Asset sales — — (15) (15) 65 — 50 0.07
Discontinued operations — — — — — 5 5 —
Segment income (loss)/Net Income
Attributable to Duke Energy Corporation $2,504 $ 408 $ (88) $2,824 $ (238) $ 79 $2,665 $ 3.76