Duke Energy 2014 Annual Report Download - page 44
Download and view the complete annual report
Please find page 44 of the 2014 Duke Energy annual report below. You can navigate through the pages in the report by either clicking on the pages listed below, or by using the keyword search tool below to find specific information within the annual report.-
 1
1 -
2
-
3
-
4
-
5
-
6
-
7
-
8
-
9
-
10
-
11
-
12
-
13
-
14
-
15
-
16
-
17
-
18
-
19
-
20
-
21
-
22
-
23
-
24
-
25
-
26
-
27
-
28
-
29
-
30
-
31
-
32
-
33
-
 34
34 -
 35
35 -
 36
36 -
 37
37 -
 38
38 -
 39
39 -
 40
40 -
 41
41 -
 42
42 -
 43
43 -
 44
44 -
 45
45 -
 46
46 -
 47
47 -
 48
48 -
 49
49 -
 50
50 -
 51
51 -
 52
52 -
 53
53 -
 54
54 -
55
-
56
-
57
-
58
-
59
-
60
-
61
-
62
-
63
-
64
-
65
-
66
-
67
-
68
-
69
-
70
-
71
-
72
-
73
-
74
-
75
-
76
-
77
-
78
-
79
-
80
-
81
-
82
-
83
-
84
-
85
-
86
-
87
-
88
-
89
-
90
-
91
-
92
-
93
-
94
-
95
-
96
-
97
-
98
-
99
-
100
-
101
-
102
-
103
-
104
-
105
-
106
-
107
-
108
-
109
-
110
-
111
-
112
-
113
-
114
-
115
-
116
-
117
-
118
-
119
-
120
-
121
-
122
-
123
-
124
-
125
-
126
-
127
-
128
-
129
-
130
-
131
-
132
-
133
-
134
-
135
-
136
-
137
-
138
-
139
-
140
-
141
-
142
-
143
-
144
-
145
-
146
-
147
-
148
-
149
-
150
-
151
-
152
-
153
-
154
-
155
-
156
-
157
-
158
-
159
-
160
-
161
-
162
-
163
-
164
-
165
-
166
-
167
-
168
-
169
-
170
-
171
-
172
-
173
-
174
-
175
-
176
-
177
-
178
-
179
-
180
-
181
-
182
-
183
-
184
-
185
-
186
-
187
-
188
-
189
-
190
-
191
-
192
-
193
-
194
-
195
-
196
-
197
-
198
-
199
-
200
-
201
-
202
-
203
-
204
-
205
-
206
-
207
-
208
-
209
-
210
-
211
-
212
-
213
-
214
-
215
-
216
-
217
-
218
-
219
-
220
-
221
-
222
-
223
-
224
-
225
-
226
-
227
-
228
-
229
-
230
-
231
-
232
-
233
-
234
-
235
-
236
-
237
-
238
-
239
-
240
-
241
-
242
-
243
-
244
-
245
-
246
-
247
-
248
-
249
-
250
-
251
-
252
-
253
-
254
-
255
-
256
-
257
-
258
-
259
-
260
-
261
-
262
-
263
-
264
 |
 |

PART I
24
COMMERCIAL POWER
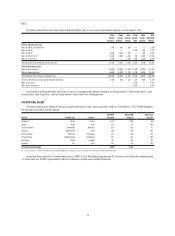
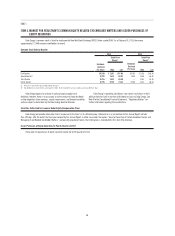
The following table provides information related to Commercial Power’s electric generation facilities as of December 31, 2014. The MW displayed in the table
below are based on summer capacity.
Facility Plant Type Primary Fuel Location
Total MW
Capacity
Owned MW
Capacity
Ownership
Interest
Duke Energy Renewables
Los Vientos Windpower Renewable Wind TX 402 402 100%
Top of the World Renewable Wind WY 200 200 100
Notrees Renewable Wind TX 153 153 100
Campbell Hill Renewable Wind WY 99 99 100
North Allegheny Renewable Wind PA 70 70 100
Laurel Hill Wind Energy Renewable Wind PA 69 69 100
Ocotillo Renewable Wind TX 59 59 100
Kit Carson Renewable Wind CO 51 51 100
Silver Sage Renewable Wind WY 42 42 100
Happy Jack Renewable Wind WY 29 29 100
Shirley Renewable Wind WI 20 20 100
Highlander Renewable Solar CA 21 21 100
Dogwood Renewable Solar NC 20 20 100
Halifax Airport Renewable Solar NC 20 20 100
Colonial Eagle – Pasquotank Renewable Solar NC 20 20 100
Bagdad Renewable Solar AZ 15 15 100
TX Solar Renewable Solar TX 14 14 100
Washington White Post Renewable Solar NC 12 12 100
Other small solar Renewable Solar Various 54 54 100
Total Duke Energy Renewables 1,370 1,370
Duke Energy Ohio
Stuart(a)(b) Fossil Steam Coal OH 2,308 900 39%
Zimmer(a) Fossil Steam Coal OH 1,300 605 46.5
Hanging Rock Combined Cycle Gas OH 1,226 1,226 100
Miami Fort (Units 7 and 8)(a) Fossil Steam Coal OH 1,020 652 64
Conesville(a)(b) Fossil Steam Coal OH 780 312 40
Washington Combined Cycle Gas OH 617 617 100
Fayette Combined Cycle Gas PA 614 614 100
Killen(a)(b) Fossil Steam Coal OH 600 198 33
Lee Combustion Turbine Gas IL 568 568 100
Dick’s Creek Combustion Turbine Gas OH 136 136 100
Miami Fort Combustion Turbine Oil OH 56 56 100
Total Duke Energy Ohio(c) 9,225 5,884
Totals By Facility Type
Renewable – Wind 1,194 1,194
Renewable – Solar 176 176
Fossil Steam 6,008 2,667
Combined Cycle 2,457 2,457
Combustion Turbine 760 760
Total Commercial Power 10,595 7,254
(a) Jointly owned with American Electric Power Generation Resources and/or The Dayton Power & Light Company.
(b) Facility is not operated by Duke Energy Ohio.
(c) Duke Energy Ohio facilities are included in the Disposal Group as of December 31, 2014.
In addition to the above facilities, Commercial Power owns an equity interest in the 585 MW capacity Sweetwater wind projects located in Texas, the 299 MW
capacity DS Cornerstone wind projects located in Kansas and the 17 MW capacity INDU Solar Holding Joint Venture. Commercial Power’s ownership share is 442 MW
of capacity in these projects.