Duke Energy 2014 Annual Report Download - page 125
Download and view the complete annual report
Please find page 125 of the 2014 Duke Energy annual report below. You can navigate through the pages in the report by either clicking on the pages listed below, or by using the keyword search tool below to find specific information within the annual report.-
 1
1 -
2
-
3
-
4
-
5
-
6
-
7
-
8
-
9
-
10
-
11
-
12
-
13
-
14
-
15
-
16
-
17
-
18
-
19
-
20
-
21
-
22
-
23
-
24
-
25
-
26
-
27
-
28
-
29
-
30
-
31
-
32
-
33
-
34
-
35
-
36
-
37
-
38
-
39
-
40
-
41
-
42
-
43
-
44
-
45
-
46
-
47
-
48
-
49
-
50
-
51
-
52
-
53
-
54
-
55
-
56
-
57
-
58
-
59
-
60
-
61
-
62
-
63
-
64
-
65
-
66
-
67
-
68
-
69
-
70
-
71
-
72
-
73
-
74
-
75
-
76
-
77
-
78
-
79
-
80
-
81
-
82
-
83
-
84
-
85
-
86
-
87
-
88
-
89
-
90
-
91
-
92
-
93
-
94
-
95
-
96
-
97
-
98
-
99
-
100
-
101
-
102
-
103
-
104
-
105
-
106
-
107
-
108
-
109
-
110
-
111
-
112
-
113
-
114
-
 115
115 -
 116
116 -
 117
117 -
 118
118 -
 119
119 -
 120
120 -
 121
121 -
 122
122 -
 123
123 -
 124
124 -
 125
125 -
 126
126 -
 127
127 -
 128
128 -
 129
129 -
 130
130 -
 131
131 -
 132
132 -
 133
133 -
 134
134 -
 135
135 -
136
-
137
-
138
-
139
-
140
-
141
-
142
-
143
-
144
-
145
-
146
-
147
-
148
-
149
-
150
-
151
-
152
-
153
-
154
-
155
-
156
-
157
-
158
-
159
-
160
-
161
-
162
-
163
-
164
-
165
-
166
-
167
-
168
-
169
-
170
-
171
-
172
-
173
-
174
-
175
-
176
-
177
-
178
-
179
-
180
-
181
-
182
-
183
-
184
-
185
-
186
-
187
-
188
-
189
-
190
-
191
-
192
-
193
-
194
-
195
-
196
-
197
-
198
-
199
-
200
-
201
-
202
-
203
-
204
-
205
-
206
-
207
-
208
-
209
-
210
-
211
-
212
-
213
-
214
-
215
-
216
-
217
-
218
-
219
-
220
-
221
-
222
-
223
-
224
-
225
-
226
-
227
-
228
-
229
-
230
-
231
-
232
-
233
-
234
-
235
-
236
-
237
-
238
-
239
-
240
-
241
-
242
-
243
-
244
-
245
-
246
-
247
-
248
-
249
-
250
-
251
-
252
-
253
-
254
-
255
-
256
-
257
-
258
-
259
-
260
-
261
-
262
-
263
-
264
 |
 |

105
PART II
DUKE ENERGY CORPORATION • DUKE ENERGY CAROLINAS, LLC • PROGRESS ENERGY, INC. •
DUKE ENERGY PROGRESS, INC. • DUKE ENERGY FLORIDA, INC. • DUKE ENERGY OHIO, INC. • DUKE ENERGY INDIANA, INC.
Combined Notes to Consolidated Financial Statements – (Continued)
SIGNIFICANT ACCOUNTING POLICIES
Use of Estimates
In preparing fi nancial statements that conform to generally accepted
accounting principles (GAAP) in the U.S., the Duke Energy Registrants must
make estimates and assumptions that affect the reported amounts of assets
and liabilities, the reported amounts of revenues and expenses, and the
disclosure of contingent assets and liabilities at the date of the fi nancial
statements. Actual results could differ from those estimates.
Regulatory Accounting
The majority of the Duke Energy Registrants’ operations are subject to
price regulation for the sale of electricity and gas by state utility commissions
or FERC. When prices are set on the basis of specifi c costs of the regulated
operations and an effective franchise is in place such that suffi cient gas or
electric services can be sold to recover those costs, the Duke Energy Registrants
apply regulatory accounting. Regulatory accounting changes the timing of the
recognition of costs or revenues relative to a company that does not apply
regulatory accounting. As a result, Regulatory assets and Regulatory liabilities
are recognized on the Consolidated Balance Sheets. Regulatory assets and
liabilities are amortized consistent with the treatment of the related cost in the
ratemaking process. See Note 4 for further information.
Regulated Fuel Costs and Purchased Power
The Duke Energy Registrants utilize cost-tracking mechanisms, commonly
referred to as fuel adjustment clauses. These clauses allow for the recovery
of fuel and fuel-related costs and portions of purchased power costs through
surcharges on customer rates. The difference between the costs incurred
and the surcharge revenues is recorded as an adjustment to Fuel Operating
Revenues – Regulated electric on the Consolidated Statements of Operations
with an offsetting impact on regulatory assets or liabilities.
Cash and Cash Equivalents
All highly liquid investments with maturities of three months or less
at the date of acquisition are considered cash equivalents. At December 31,
2014, $1,680 million of Duke Energy’s total cash and cash equivalents is
held by entities domiciled in foreign jurisdictions. During the fourth quarter of
2014, Duke Energy declared a taxable dividend of historical foreign earnings in
the form of notes payable that will result in the repatriation of approximately
$2.7 billion in cash held and expected to be generated by International Energy
over a period of up to 8 years. See Note 22 to the Consolidated Financial
Statements, “Income Taxes,” for additional information.
Restricted Cash
The Duke Energy Registrants have restricted cash related primarily
to collateral assets, escrow deposits and variable interest entities (VIEs).
Restricted cash balances are refl ected in Other within Current Assets and in
Other within Investments and Other Assets on the Consolidated Balance Sheets.
At December 31, 2014 and 2013, Duke Energy had restricted cash totaling
$298 million and $307 million, respectively.
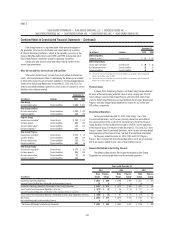
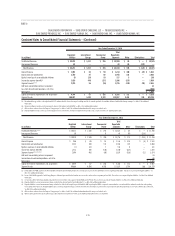
Inventory
Inventory is used for operations and is recorded primarily using the
average cost method. Inventory related to regulated operations is valued at
historical cost. Inventory related to nonregulated operations is valued at the
lower of cost or market. Materials and supplies are recorded as inventory when
purchased and subsequently charged to expense or capitalized to property, plant
and equipment when installed. Reserves are established for excess and obsolete
inventory. The components of inventory are presented in the tables below.
December 31, 2014
(in millions)
Duke
Energy
Duke
Energy
Carolinas
Progress
Energy
Duke
Energy
Progress
Duke
Energy
Florida
Duke
Energy
Ohio
Duke
Energy
Indiana
Materials and supplies $ 2,102 $ 719 $ 981 $ 676 $ 305 $ 67 $ 258
Coal held for electric generation 997 362 329 150 178 21 275
Oil, gas and other fuel held for electric generation 360 43 280 140 140 9 4
Total inventory $ 3,459 $ 1,124 $ 1,590 $ 966 $ 623 $ 97 $ 537
December 31, 2013
(in millions)
Duke
Energy
Duke
Energy
Carolinas
Progress
Energy
Duke
Energy
Progress
Duke
Energy
Florida
Duke
Energy
Ohio
Duke
Energy
Indiana
Materials and supplies $ 1,901 $ 654 $ 854 $ 567 $ 287 $ 117 $ 193
Coal held for electric generation 1,018 374 334 187 147 65 238
Oil, gas and other fuel held for electric generation 331 37 236 99 137 47 3
Total inventory $ 3,250 $ 1,065 $ 1,424 $ 853 $ 571 $ 229 $ 434