Duke Energy 2014 Annual Report Download - page 231
Download and view the complete annual report
Please find page 231 of the 2014 Duke Energy annual report below. You can navigate through the pages in the report by either clicking on the pages listed below, or by using the keyword search tool below to find specific information within the annual report.-
 1
1 -
2
-
3
-
4
-
5
-
6
-
7
-
8
-
9
-
10
-
11
-
12
-
13
-
14
-
15
-
16
-
17
-
18
-
19
-
20
-
21
-
22
-
23
-
24
-
25
-
26
-
27
-
28
-
29
-
30
-
31
-
32
-
33
-
34
-
35
-
36
-
37
-
38
-
39
-
40
-
41
-
42
-
43
-
44
-
45
-
46
-
47
-
48
-
49
-
50
-
51
-
52
-
53
-
54
-
55
-
56
-
57
-
58
-
59
-
60
-
61
-
62
-
63
-
64
-
65
-
66
-
67
-
68
-
69
-
70
-
71
-
72
-
73
-
74
-
75
-
76
-
77
-
78
-
79
-
80
-
81
-
82
-
83
-
84
-
85
-
86
-
87
-
88
-
89
-
90
-
91
-
92
-
93
-
94
-
95
-
96
-
97
-
98
-
99
-
100
-
101
-
102
-
103
-
104
-
105
-
106
-
107
-
108
-
109
-
110
-
111
-
112
-
113
-
114
-
115
-
116
-
117
-
118
-
119
-
120
-
121
-
122
-
123
-
124
-
125
-
126
-
127
-
128
-
129
-
130
-
131
-
132
-
133
-
134
-
135
-
136
-
137
-
138
-
139
-
140
-
141
-
142
-
143
-
144
-
145
-
146
-
147
-
148
-
149
-
150
-
151
-
152
-
153
-
154
-
155
-
156
-
157
-
158
-
159
-
160
-
161
-
162
-
163
-
164
-
165
-
166
-
167
-
168
-
169
-
170
-
171
-
172
-
173
-
174
-
175
-
176
-
177
-
178
-
179
-
180
-
181
-
182
-
183
-
184
-
185
-
186
-
187
-
188
-
189
-
190
-
191
-
192
-
193
-
194
-
195
-
196
-
197
-
198
-
199
-
200
-
201
-
202
-
203
-
204
-
205
-
206
-
207
-
208
-
209
-
210
-
211
-
212
-
213
-
214
-
215
-
216
-
217
-
218
-
219
-
220
-
 221
221 -
 222
222 -
 223
223 -
 224
224 -
 225
225 -
 226
226 -
 227
227 -
 228
228 -
 229
229 -
 230
230 -
 231
231 -
 232
232 -
 233
233 -
 234
234 -
 235
235 -
 236
236 -
 237
237 -
 238
238 -
 239
239 -
 240
240 -
 241
241 -
242
-
243
-
244
-
245
-
246
-
247
-
248
-
249
-
250
-
251
-
252
-
253
-
254
-
255
-
256
-
257
-
258
-
259
-
260
-
261
-
262
-
263
-
264
 |
 |

211
PART II
DUKE ENERGY CORPORATION • DUKE ENERGY CAROLINAS, LLC • PROGRESS ENERGY, INC. •
DUKE ENERGY PROGRESS, INC. • DUKE ENERGY FLORIDA, INC. • DUKE ENERGY OHIO, INC. • DUKE ENERGY INDIANA, INC.
Combined Notes to Consolidated Financial Statements – (Continued)
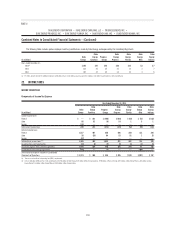
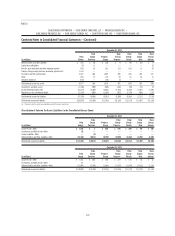
25. QUARTERLY FINANCIAL DATA (UNAUDITED)
DUKE ENERGY
Quarterly EPS amounts are meant to be stand-alone calculations and are
not always additive to the full-year amount due to rounding and the weighting of
share issuances.
(in millions, except per share data)
First
Quarter(a)
Second
Quarter(a)
Third
Quarter(a)
Fourth
Quarter(a) Total
2014
Operating revenues $6,263 $5,708 $6,395 $5,559 $23,925
Operating income 1,362 1,289 1,619 988 5,258
Income from continuing operations 750 725 891 99 2,465
(Loss) income from discontinued
operations, net of tax (843) (112) 378 1 (576)
Net loss (income) (93) 613 1,269 100 1,889
Net loss (income) attributable to Duke
Energy Corporation (97) 609 1,274 97 1,883
Earnings per share:
Income from continuing operations
attributable to Duke Energy
Corporation common shareholders
Basic $ 1.05 $ 1.02 $ 1.25 $ 0.14 $ 3.46
Diluted $ 1.05 $ 1.02 $ 1.25 $ 0.14 $ 3.46
(Loss) income from discontinued
operations attributable to Duke Energy
Corporation common shareholders
Basic $ (1.19) $ (0.16) $ 0.55 $ — $ (0.80)
Diluted $ (1.19) $ (0.16) $ 0.55 $ — $ (0.80)
Net (loss) income attributable to Duke
Energy Corporation common
shareholders
Basic $ (0.14) $ 0.86 $ 1.80 $ 0.14 $ 2.66
Diluted $ (0.14) $ 0.86 $ 1.80 $ 0.14 $ 2.66
2013
Operating revenues $5,536 $5,393 $6,217 $5,610 $22,756
Operating income 1,259 742 1,660 1,193 4,854
Income from continuing operations 663 292 946 689 2,590
(Loss) income from discontinued
operations, net of tax (29) 50 62 3 86
Net income 634 342 1,008 692 2,676
Net income attributable to Duke
Energy Corporation 634 339 1,004 688 2,665
Earnings per share:
Income from continuing operations
attributable to Duke Energy
Corporation common shareholders
Basic $ 0.93 $ 0.40 $ 1.33 $ 0.96 $ 3.64
Diluted $ 0.93 $ 0.40 $ 1.33 $ 0.96 $ 3.63
(Loss) income from discontinued
operations attributable to Duke Energy
Corporation common shareholders
Basic $ (0.04) $ 0.08 $ 0.09 $ 0.01 $ 0.13
Diluted $ (0.04) $ 0.08 $ 0.09 $ 0.01 $ 0.13
Net income attributable to Duke Energy
Corporation common shareholders
Basic $ 0.89 $ 0.48 $ 1.42 $ 0.97 $ 3.77
Diluted $ 0.89 $ 0.48 $ 1.42 $ 0.97 $ 3.76
(a) Operating results refl ect reclassifi cations due to the impact of discontinued
operations (see Note 2 for further information).
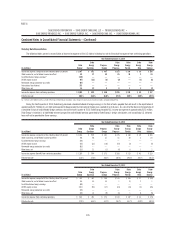
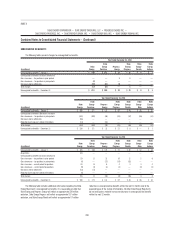
The following table includes unusual or infrequently occurring items in
each quarter during the two most recently completed fi scal years. All amounts
discussed below are pretax unless otherwise noted.
(in millions)
First
Quarter
Second
Quarter
Third
Quarter
Fourth
Quarter Total
2014
Costs to achieve Progress Energy merger
(see Note 2) $ (55) $ (61) $ (56) $ (33) $ (205)
Midwest Generation Impairment
(see Note 2) (1,287) — 477 (39) (849)
Coal ash Plea Agreements Reserve
(see Note 5) — — — (102) (102)
International Tax Adjustment
(see Note 22) — — — (373) (373)
Asset Impairment (see Note 11) (94) — — — (94)
Total $(1,436) $ (61) $ 421 $ (547) $(1,623)
2013(a)
Costs to achieve Progress Energy merger
(see Note 2) $ (55) $ (82) $ (88) $ (72) $ (297)
Crystal River Unit 3 charges (see Note 4) — (295) — (57) (352)
Harris and Levy nuclear development
charges (see Note 4) — (87) — — (87)
Gain on sale of DukeNet (see Note 12) — — — 105 105
Total $ (55) $ (464) $ (88) $ (24) $ (631)
(a) Revised retail rates became effective in January for Duke Energy Florida, May for Duke Energy Ohio, June
for Duke Energy Progress and September for Duke Energy Carolinas (see Note 4 for further information).
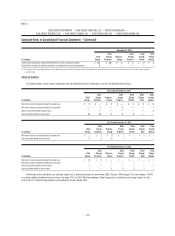
DUKE ENERGY CAROLINAS
(in millions)
First
Quarter
Second
Quarter
Third
Quarter
Fourth
Quarter Total
2014
Operating revenues $2,000 $1,755 $1,938 $1,658 $7,351
Operating income 509 438 630 318 1,895
Net income 286 270 377 139 1,072
2013
Operating revenues $1,729 $1,591 $1,919 $1,715 $6,954
Operating income 434 351 604 420 1,809
Net income 244 181 342 209 976
The following table includes unusual or infrequently occurring items in
each quarter during the two most recently completed fi scal years. All amounts
discussed below are pretax unless otherwise noted.
(in millions)
First
Quarter
Second
Quarter
Third
Quarter
Fourth
Quarter Total
2014
Costs to achieve Progress Energy merger
(see Note 2) $ (29) $ (38) $ (25) $ (17) $ (109)
Coal ash Plea Agreements Reserve (see
Note 5) — — — (72) (72)
Total $ (29) $ (38) $ (25) $ (89) $ (181)
2013(a)
Costs to achieve Progress Energy merger
(see Note 2) $ (22) $ (35) $ (34) $ (29) $ (120)
(a) Revised retail rates became effective in September in both North Carolina and South Carolina (see Note 4
for further information).