Duke Energy 2014 Annual Report Download - page 168
Download and view the complete annual report
Please find page 168 of the 2014 Duke Energy annual report below. You can navigate through the pages in the report by either clicking on the pages listed below, or by using the keyword search tool below to find specific information within the annual report.-
 1
1 -
2
-
3
-
4
-
5
-
6
-
7
-
8
-
9
-
10
-
11
-
12
-
13
-
14
-
15
-
16
-
17
-
18
-
19
-
20
-
21
-
22
-
23
-
24
-
25
-
26
-
27
-
28
-
29
-
30
-
31
-
32
-
33
-
34
-
35
-
36
-
37
-
38
-
39
-
40
-
41
-
42
-
43
-
44
-
45
-
46
-
47
-
48
-
49
-
50
-
51
-
52
-
53
-
54
-
55
-
56
-
57
-
58
-
59
-
60
-
61
-
62
-
63
-
64
-
65
-
66
-
67
-
68
-
69
-
70
-
71
-
72
-
73
-
74
-
75
-
76
-
77
-
78
-
79
-
80
-
81
-
82
-
83
-
84
-
85
-
86
-
87
-
88
-
89
-
90
-
91
-
92
-
93
-
94
-
95
-
96
-
97
-
98
-
99
-
100
-
101
-
102
-
103
-
104
-
105
-
106
-
107
-
108
-
109
-
110
-
111
-
112
-
113
-
114
-
115
-
116
-
117
-
118
-
119
-
120
-
121
-
122
-
123
-
124
-
125
-
126
-
127
-
128
-
129
-
130
-
131
-
132
-
133
-
134
-
135
-
136
-
137
-
138
-
139
-
140
-
141
-
142
-
143
-
144
-
145
-
146
-
147
-
148
-
149
-
150
-
151
-
152
-
153
-
154
-
155
-
156
-
157
-
 158
158 -
 159
159 -
 160
160 -
 161
161 -
 162
162 -
 163
163 -
 164
164 -
 165
165 -
 166
166 -
 167
167 -
 168
168 -
 169
169 -
 170
170 -
 171
171 -
 172
172 -
 173
173 -
 174
174 -
 175
175 -
 176
176 -
 177
177 -
 178
178 -
179
-
180
-
181
-
182
-
183
-
184
-
185
-
186
-
187
-
188
-
189
-
190
-
191
-
192
-
193
-
194
-
195
-
196
-
197
-
198
-
199
-
200
-
201
-
202
-
203
-
204
-
205
-
206
-
207
-
208
-
209
-
210
-
211
-
212
-
213
-
214
-
215
-
216
-
217
-
218
-
219
-
220
-
221
-
222
-
223
-
224
-
225
-
226
-
227
-
228
-
229
-
230
-
231
-
232
-
233
-
234
-
235
-
236
-
237
-
238
-
239
-
240
-
241
-
242
-
243
-
244
-
245
-
246
-
247
-
248
-
249
-
250
-
251
-
252
-
253
-
254
-
255
-
256
-
257
-
258
-
259
-
260
-
261
-
262
-
263
-
264
 |
 |

148
PART II
DUKE ENERGY CORPORATION • DUKE ENERGY CAROLINAS, LLC • PROGRESS ENERGY, INC. •
DUKE ENERGY PROGRESS, INC. • DUKE ENERGY FLORIDA, INC. • DUKE ENERGY OHIO, INC. • DUKE ENERGY INDIANA, INC.
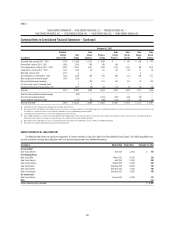
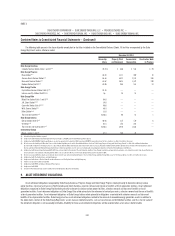
Combined Notes to Consolidated Financial Statements – (Continued)
December 31, 2013
(in millions)
Estimated
Useful Life
(Years)
Duke
Energy
Duke
Energy
Carolinas
Progress
Energy
Duke
Energy
Progress
Duke
Energy
Florida
Duke
Energy
Ohio
Duke
Energy
Indiana
Land $ 1,481 $ 397 $ 705 $ 383 $ 321 $ 137 $ 105
Plant – Regulated
Electric generation, distribution and transmission 2 – 125 78,272 30,018 31,792 19,190 12,601 3,925 11,594
Natural gas transmission and distribution 12 – 67 2,138 — — — — 2,138 —
Other buildings and improvements 2 – 100 1,397 447 610 282 315 190 159
Plant – Nonregulated
Electric generation, distribution and transmission 2 – 100 6,267 — — — — 4,017 —
Other buildings and improvements 9 –100 2,512 — — — — 5 —
Nuclear fuel 2,458 1,446 1,012 1,012———
Equipment 1 – 33 1,557 287 621 357 94 317 146
Construction in process 3,595 1,741 873 631 238 166 307
Other 5 – 33 3,438 570 867 418 294 248 178
Total property, plant and equipment(a)(d) 103,115 34,906 36,480 22,273 13,863 11,143 12,489
Total accumulated depreciation – regulated(b)(c)(d) (31,659) (11,894) (13,098) (8,623) (4,252) (2,160) (3,913)
Total accumulated depreciation – nonregulated(c)(d) (1,966) — — — — (748) —
Total net property, plant and equipment $ 69,490 $ 23,012 $ 23,382 $13,650 $ 9,611 $ 8,235 $ 8,576
(a) Includes capitalized leases of $1,606 million, $53 million, $328 million, $148 million, $180 million, $96 million, and $30 million at Duke Energy, Duke Energy Carolinas, Progress Energy, Duke Energy Progress, Duke Energy
Florida, Duke Energy Ohio, and Duke Energy Indiana, respectively, primarily in regulated plant. The Progress Energy, Duke Energy Progress and Duke Energy Florida amounts are net of $60 million, an insignifi cant amount and
$57 million, respectively, of accumulated amortization of capitalized leases.
(b) Includes $1,118 million, $681 million, $438 million and $438 million of accumulated amortization of nuclear fuel at Duke Energy, Duke Energy Carolinas, Progress Energy and Duke Energy Progress, respectively.
(c) Includes accumulated amortization of capitalized leases of $40 million, $4 million, $21 million and $5 million at Duke Energy, Duke Energy Carolinas, Duke Energy Ohio and Duke Energy Indiana, respectively.
(d) Includes gross property, plant and equipment cost of consolidated VIEs of $1,678 million and accumulated depreciation of consolidated VIEs of $175 million at Duke Energy.
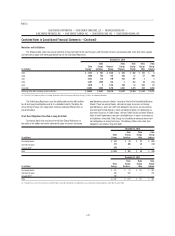
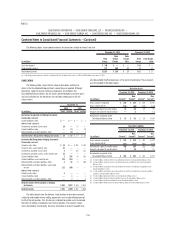
The following table presents capitalized interest, which includes the debt component of AFUDC.
Years Ended December 31,
(in millions) 2014 2013 2012
Duke Energy $75 $ 89 $176
Duke Energy Carolinas 38 41 72
Progress Energy 11 19 41
Duke Energy Progress 10 16 23
Duke Energy Florida 1318
Duke Energy Ohio 10 11 13
Duke Energy Indiana 6939