Duke Energy 2014 Annual Report Download - page 233
Download and view the complete annual report
Please find page 233 of the 2014 Duke Energy annual report below. You can navigate through the pages in the report by either clicking on the pages listed below, or by using the keyword search tool below to find specific information within the annual report.-
 1
1 -
2
-
3
-
4
-
5
-
6
-
7
-
8
-
9
-
10
-
11
-
12
-
13
-
14
-
15
-
16
-
17
-
18
-
19
-
20
-
21
-
22
-
23
-
24
-
25
-
26
-
27
-
28
-
29
-
30
-
31
-
32
-
33
-
34
-
35
-
36
-
37
-
38
-
39
-
40
-
41
-
42
-
43
-
44
-
45
-
46
-
47
-
48
-
49
-
50
-
51
-
52
-
53
-
54
-
55
-
56
-
57
-
58
-
59
-
60
-
61
-
62
-
63
-
64
-
65
-
66
-
67
-
68
-
69
-
70
-
71
-
72
-
73
-
74
-
75
-
76
-
77
-
78
-
79
-
80
-
81
-
82
-
83
-
84
-
85
-
86
-
87
-
88
-
89
-
90
-
91
-
92
-
93
-
94
-
95
-
96
-
97
-
98
-
99
-
100
-
101
-
102
-
103
-
104
-
105
-
106
-
107
-
108
-
109
-
110
-
111
-
112
-
113
-
114
-
115
-
116
-
117
-
118
-
119
-
120
-
121
-
122
-
123
-
124
-
125
-
126
-
127
-
128
-
129
-
130
-
131
-
132
-
133
-
134
-
135
-
136
-
137
-
138
-
139
-
140
-
141
-
142
-
143
-
144
-
145
-
146
-
147
-
148
-
149
-
150
-
151
-
152
-
153
-
154
-
155
-
156
-
157
-
158
-
159
-
160
-
161
-
162
-
163
-
164
-
165
-
166
-
167
-
168
-
169
-
170
-
171
-
172
-
173
-
174
-
175
-
176
-
177
-
178
-
179
-
180
-
181
-
182
-
183
-
184
-
185
-
186
-
187
-
188
-
189
-
190
-
191
-
192
-
193
-
194
-
195
-
196
-
197
-
198
-
199
-
200
-
201
-
202
-
203
-
204
-
205
-
206
-
207
-
208
-
209
-
210
-
211
-
212
-
213
-
214
-
215
-
216
-
217
-
218
-
219
-
220
-
221
-
222
-
 223
223 -
 224
224 -
 225
225 -
 226
226 -
 227
227 -
 228
228 -
 229
229 -
 230
230 -
 231
231 -
 232
232 -
 233
233 -
 234
234 -
 235
235 -
 236
236 -
 237
237 -
 238
238 -
 239
239 -
 240
240 -
 241
241 -
 242
242 -
 243
243 -
244
-
245
-
246
-
247
-
248
-
249
-
250
-
251
-
252
-
253
-
254
-
255
-
256
-
257
-
258
-
259
-
260
-
261
-
262
-
263
-
264
 |
 |

213
PART II
DUKE ENERGY CORPORATION • DUKE ENERGY CAROLINAS, LLC • PROGRESS ENERGY, INC. •
DUKE ENERGY PROGRESS, INC. • DUKE ENERGY FLORIDA, INC. • DUKE ENERGY OHIO, INC. • DUKE ENERGY INDIANA, INC.
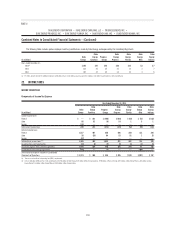
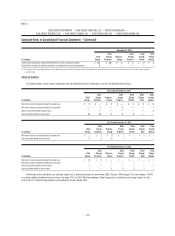
Combined Notes to Consolidated Financial Statements – (Continued)
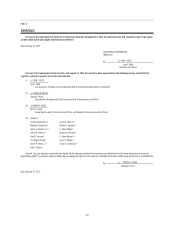
DUKE ENERGY OHIO
(in millions)
First
Quarter(a)
Second
Quarter(a)
Third
Quarter(a)
Fourth
Quarter(a) Total
2014
Operating revenues $ 575 $ 412 $ 446 $ 480 $1,913
Operating (loss) income (7) 62 58 74 187
(Loss) income from discontinued
operations, net of tax (875) (135) 413 34 (563)
Net (loss) income (890) (108) 439 64 (495)
2013
Operating revenues $ 503 $ 408 $ 438 $ 456 $1,805
Operating income 56 27 50 49 182
(Loss) income from discontinued
operations, net of tax (47) 51 35 (4) 35
Net (loss) income (21) 58 59 6 102
(a) Operating results refl ect reclassifi cations due to the impact of discontinued operations (see Note 2 for
further information).
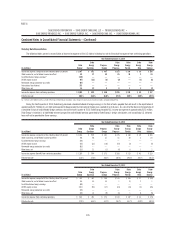
The following table includes unusual or infrequently occurring items in
each quarter during the two most recently completed fi scal years. All amounts
discussed below are pretax unless otherwise noted.
(in millions)
First
Quarter
Second
Quarter
Third
Quarter
Fourth
Quarter Total
2014
Costs to achieve Progress Energy
merger (see Note 2) $ (2) $ (4) $ (3) $ (2) $ (11)
Midwest Generation Impairment
(see Note 2) (1,318) — 477 (39) (880)
Asset Impairment (see Note 11) (94) — — — (94)
Total $ (1,414) $ (4) $ 474 $ (41) $ (985)
2013(a)
Costs to achieve Progress Energy
merger (see Note 2) $ (4) $ (4) $ (4) $ (4) $ (16)
(a) Revised retail rates became effective in May (see Note 4 for further information).
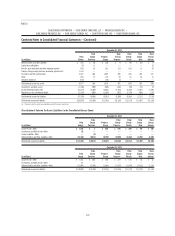
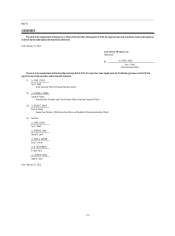
DUKE ENERGY INDIANA
(in millions)
First
Quarter
Second
Quarter
Third
Quarter
Fourth
Quarter Total
2014
Operating revenues $ 845 $748 $790 $792 $3,175
Operating income 215 178 182 130 705
Net income 113 87 101 58 359
2013
Operating revenues $ 724 $700 $755 $ 747 $2,926
Operating income 181 168 203 181 733
Net income 90 82 104 82 358
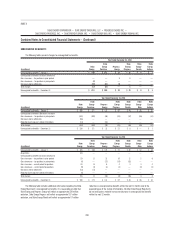
The following table includes unusual or infrequently occurring items in
each quarter during the two most recently completed fi scal years. All amounts
discussed below are pretax unless otherwise noted.
(in millions)
First
Quarter
Second
Quarter
Third
Quarter
Fourth
Quarter Total
2014
Costs to achieve Progress Energy merger
(see Note 2) $ (2) $ (5) $ (3) $ (2) $ (12)
2013
Costs to achieve Progress Energy merger
(see Note 2) $ (4) $ (5) $ (5) $ (5) $ (19)