Duke Energy 2014 Annual Report Download - page 19
Download and view the complete annual report
Please find page 19 of the 2014 Duke Energy annual report below. You can navigate through the pages in the report by either clicking on the pages listed below, or by using the keyword search tool below to find specific information within the annual report.-
 1
1 -
2
-
3
-
4
-
5
-
6
-
7
-
8
-
 9
9 -
 10
10 -
 11
11 -
 12
12 -
 13
13 -
 14
14 -
 15
15 -
 16
16 -
 17
17 -
 18
18 -
 19
19 -
 20
20 -
 21
21 -
 22
22 -
 23
23 -
 24
24 -
 25
25 -
 26
26 -
 27
27 -
 28
28 -
 29
29 -
30
-
31
-
32
-
33
-
34
-
35
-
36
-
37
-
38
-
39
-
40
-
41
-
42
-
43
-
44
-
45
-
46
-
47
-
48
-
49
-
50
-
51
-
52
-
53
-
54
-
55
-
56
-
57
-
58
-
59
-
60
-
61
-
62
-
63
-
64
-
65
-
66
-
67
-
68
-
69
-
70
-
71
-
72
-
73
-
74
-
75
-
76
-
77
-
78
-
79
-
80
-
81
-
82
-
83
-
84
-
85
-
86
-
87
-
88
-
89
-
90
-
91
-
92
-
93
-
94
-
95
-
96
-
97
-
98
-
99
-
100
-
101
-
102
-
103
-
104
-
105
-
106
-
107
-
108
-
109
-
110
-
111
-
112
-
113
-
114
-
115
-
116
-
117
-
118
-
119
-
120
-
121
-
122
-
123
-
124
-
125
-
126
-
127
-
128
-
129
-
130
-
131
-
132
-
133
-
134
-
135
-
136
-
137
-
138
-
139
-
140
-
141
-
142
-
143
-
144
-
145
-
146
-
147
-
148
-
149
-
150
-
151
-
152
-
153
-
154
-
155
-
156
-
157
-
158
-
159
-
160
-
161
-
162
-
163
-
164
-
165
-
166
-
167
-
168
-
169
-
170
-
171
-
172
-
173
-
174
-
175
-
176
-
177
-
178
-
179
-
180
-
181
-
182
-
183
-
184
-
185
-
186
-
187
-
188
-
189
-
190
-
191
-
192
-
193
-
194
-
195
-
196
-
197
-
198
-
199
-
200
-
201
-
202
-
203
-
204
-
205
-
206
-
207
-
208
-
209
-
210
-
211
-
212
-
213
-
214
-
215
-
216
-
217
-
218
-
219
-
220
-
221
-
222
-
223
-
224
-
225
-
226
-
227
-
228
-
229
-
230
-
231
-
232
-
233
-
234
-
235
-
236
-
237
-
238
-
239
-
240
-
241
-
242
-
243
-
244
-
245
-
246
-
247
-
248
-
249
-
250
-
251
-
252
-
253
-
254
-
255
-
256
-
257
-
258
-
259
-
260
-
261
-
262
-
263
-
264
 |
 |

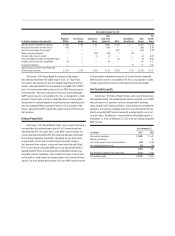
Year Ended December 31, 2012
(in millions, except per share amounts)
Regulated
Utilities
International
Energy
Commercial
Power
Total
Reportable
Segments Other
Eliminations/
Discontinued
Duke
Energy
Per
Diluted
Share
Adjusted segment income/Adjusted earnings $2,086 $ 439 $ 93 $2,618 $(129) $ — $2,489 $ 4.33
Edwardsport impairment and other charges (402) — — (402) — — (402) (0.70)
Costs to achieve Progress Energy merger — — — — (397) — (397) (0.70)
Midwest generation operations — — (149) (149) 9 140 — —
Economic hedges (mark-to-market) — — (3) (3) — — (3) (0.01)
Democratic National Convention Host Committee support — — — — (6) — (6) (0.01)
Employee severance and offi ce consolidation 60 — — 60 — — 60 0.11
Discontinued operations — — — — — 27 27 0.05
Segment income (loss)/Net Income Attributable
to Duke Energy Corporation $1,744 $ 439 $ (59) $2,124 $(523) $ 167 $1,768 $ 3.07
Duke Energy’s 2014 Annual Report also references Duke Energy’s
forecasted adjusted diluted EPS outlook range of $4.55 - $4.75 per share.
The materials also reference the long-term targeted range of growth of 4 to 6
percent in adjusted diluted EPS (on a compound annual growth rate (“CAGR”)
basis). Due to the forward-looking nature of this non-GAAP fi nancial measure
for future periods, information to reconcile it to the most directly comparable
GAAP fi nancial measure is not available at this time, as management is unable
to project all special items or mark-to-market adjustments for future periods.
Irrespective of discontinued operations accounting treatment, operating results
from the nonregulated Midwest generation business will be included in Duke
Energy’s adjusted diluted EPS and adjusted segment income until the close of
the transaction.
Dividend Payout Ratio
Duke Energy’s 2014 Annual Report includes a discussion of Duke Energy’s
anticipated long-term dividend payout ratio of 65 to 70 percent based upon
adjusted diluted EPS. This payout ratio is a non-GAAP fi nancial measure as it
is based upon forecasted diluted EPS from continuing operations attributable
to Duke Energy Corporation shareholders, adjusted for the per-share impact
of special items and the mark-to-market impacts of economic hedges in
the Commercial Power segment, as discussed above under Adjusted Diluted
EPS. The most directly comparable GAAP measure for adjusted diluted EPS is
reported diluted EPS from continuing operations attributable to Duke Energy
Corporation common shareholders, which includes the impact of special items
and the mark-to-market impacts of economic hedges in the Commercial Power
segment. Due to the forward-looking nature of this non-GAAP fi nancial measure
for future periods, information to reconcile it to the most directly comparable
GAAP fi nancial measure is not available at this time, as management is unable
to project special items or mark-to-market adjustments for future periods.
Total Available Liquidity
Duke Energy’s 2014 Annual Report includes a discussion of Duke Energy’s
total available liquidity. The available liquidity balance presented is a non-GAAP
fi nancial measure as it represents cash and cash equivalents (excluding
certain amounts held in foreign jurisdictions and cash otherwise unavailable for
operations) and remaining availability under the master credit facility. The most
directly comparable GAAP fi nancial measure for available liquidity is cash and
cash equivalents. The following is a reconciliation of total available liquidity as
of December 31, 2014 and December 31, 2013, to the most directly comparable
GAAP measure:
As of December 31,
(in millions) 2014 2013
Cash and cash equivalents $ 2,036 $ 1,501
Short-term investments — 44
Less: Certain amounts held in foreign jurisdictions (442) (1,139)
Less: Unavailable domestic cash (34) (24)
1,560 382
Plus: Remaining availability under master credit 3,793 5,248
Total available liquidity $ 5,353 $ 5,630