Duke Energy 2014 Annual Report Download - page 202
Download and view the complete annual report
Please find page 202 of the 2014 Duke Energy annual report below. You can navigate through the pages in the report by either clicking on the pages listed below, or by using the keyword search tool below to find specific information within the annual report.-
 1
1 -
2
-
3
-
4
-
5
-
6
-
7
-
8
-
9
-
10
-
11
-
12
-
13
-
14
-
15
-
16
-
17
-
18
-
19
-
20
-
21
-
22
-
23
-
24
-
25
-
26
-
27
-
28
-
29
-
30
-
31
-
32
-
33
-
34
-
35
-
36
-
37
-
38
-
39
-
40
-
41
-
42
-
43
-
44
-
45
-
46
-
47
-
48
-
49
-
50
-
51
-
52
-
53
-
54
-
55
-
56
-
57
-
58
-
59
-
60
-
61
-
62
-
63
-
64
-
65
-
66
-
67
-
68
-
69
-
70
-
71
-
72
-
73
-
74
-
75
-
76
-
77
-
78
-
79
-
80
-
81
-
82
-
83
-
84
-
85
-
86
-
87
-
88
-
89
-
90
-
91
-
92
-
93
-
94
-
95
-
96
-
97
-
98
-
99
-
100
-
101
-
102
-
103
-
104
-
105
-
106
-
107
-
108
-
109
-
110
-
111
-
112
-
113
-
114
-
115
-
116
-
117
-
118
-
119
-
120
-
121
-
122
-
123
-
124
-
125
-
126
-
127
-
128
-
129
-
130
-
131
-
132
-
133
-
134
-
135
-
136
-
137
-
138
-
139
-
140
-
141
-
142
-
143
-
144
-
145
-
146
-
147
-
148
-
149
-
150
-
151
-
152
-
153
-
154
-
155
-
156
-
157
-
158
-
159
-
160
-
161
-
162
-
163
-
164
-
165
-
166
-
167
-
168
-
169
-
170
-
171
-
172
-
173
-
174
-
175
-
176
-
177
-
178
-
179
-
180
-
181
-
182
-
183
-
184
-
185
-
186
-
187
-
188
-
189
-
190
-
191
-
 192
192 -
 193
193 -
 194
194 -
 195
195 -
 196
196 -
 197
197 -
 198
198 -
 199
199 -
 200
200 -
 201
201 -
 202
202 -
 203
203 -
 204
204 -
 205
205 -
 206
206 -
 207
207 -
 208
208 -
 209
209 -
 210
210 -
 211
211 -
 212
212 -
213
-
214
-
215
-
216
-
217
-
218
-
219
-
220
-
221
-
222
-
223
-
224
-
225
-
226
-
227
-
228
-
229
-
230
-
231
-
232
-
233
-
234
-
235
-
236
-
237
-
238
-
239
-
240
-
241
-
242
-
243
-
244
-
245
-
246
-
247
-
248
-
249
-
250
-
251
-
252
-
253
-
254
-
255
-
256
-
257
-
258
-
259
-
260
-
261
-
262
-
263
-
264
 |
 |

182
PART II
DUKE ENERGY CORPORATION • DUKE ENERGY CAROLINAS, LLC • PROGRESS ENERGY, INC. •
DUKE ENERGY PROGRESS, INC. • DUKE ENERGY FLORIDA, INC. • DUKE ENERGY OHIO, INC. • DUKE ENERGY INDIANA, INC.
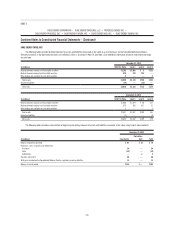
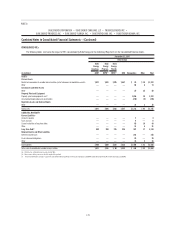
Combined Notes to Consolidated Financial Statements – (Continued)
December 31, 2013
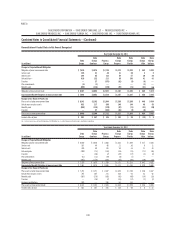
Duke Energy
(in millions) Renewables Other Total
Duke
Energy
Ohio
Duke
Energy
Indiana
Receivables $ — $ — $ — $ 114 $ 143
Investments in equity method unconsolidated affi liates 153 60 213 — —
Intangibles —969696—
Investments and other assets — 4 4 — —
Total assets 153 160 313 210 143
Other current liabilities — 3 3 — —
Deferred credits and other liabilities — 15 15 — —
Total liabilities — 18 18 — —
Net assets $ 153 $ 142 $ 295 $ 210 $ 143
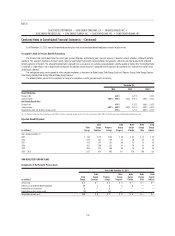
The Duke Energy Registrants are not aware of any situations where the
maximum exposure to loss signifi cantly exceeds the carrying values shown
above except for the power purchase agreement with OVEC, which is discussed
below, and various guarantees, some of which are refl ected in the table above
as Deferred credits and other liabilities. For more information on various
guarantees, refer to Note 7, “Guarantees and Indemnifi cations.”
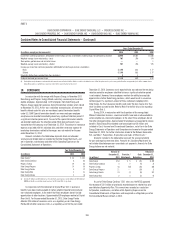
Renewables
Duke Energy has investments in various renewable energy project entities.
Some of these entities are VIEs due to long-term fi xed price power purchase
agreements. These fi xed price agreements effectively transfer commodity price
risk to the buyer of the power. Duke Energy does not consolidate these VIEs
because power to direct and control key activities is shared jointly by Duke
Energy and other owners.
Other
At December 31, 2013, the most signifi cant of the Other non-consolidated
VIEs was Duke Energy Ohio’s 9 percent ownership interest in OVEC. Through its
ownership interest in OVEC, Duke Energy Ohio has a contractual arrangement
to buy power from OVEC’s power plants through June 2040. The initial carrying
value of this contract was recorded as an intangible asset when Duke Energy
acquired Cinergy in April 2006. Proceeds from the sale of power by OVEC to its
power purchase agreement counterparties are designed to be suffi cient to meet
its operating expenses, fi xed costs, debt amortization and interest expense, as
well as earn a return on equity. Accordingly, the value of this contract is subject
to variability due to fl uctuations in power prices and changes in OVEC’s costs of
business, including costs associated with its 2,256 MW of coal-fi red generation
capacity. Proposed environmental rulemaking could increase the costs of OVEC,
which would be passed through to Duke Energy Ohio. In 2014, Duke Energy
recorded a $94 million impairment related to OVEC.
CRC
See discussion under Consolidated VIEs for additional information related
to CRC.
Amounts included in Receivables in the above table for Duke Energy
Ohio and Duke Energy Indiana refl ect their retained interest in receivables
sold to CRC. These subordinated notes held by Duke Energy Ohio and Duke
Energy Indiana are stated at fair value. Carrying values of retained interests are
determined by allocating carrying value of the receivables between assets sold
and interests retained based on relative fair value. The allocated bases of the
subordinated notes are not materially different than their face value because (i)
the receivables generally turnover in less than two months, (ii) credit losses are
reasonably predictable due to the broad customer base and lack of signifi cant
concentration, and (iii) the equity in CRC is subordinate to all retained interests
and thus would absorb losses fi rst. The hypothetical effect on fair value of the
retained interests assuming both a 10 percent and a 20 percent unfavorable
variation in credit losses or discount rates is not material due to the short
turnover of receivables and historically low credit loss history. Interest accrues
to Duke Energy Ohio and Duke Energy Indiana on the retained interests using the
acceptable yield method. This method generally approximates the stated rate
on the notes since the allocated basis and the face value are nearly equivalent.
An impairment charge is recorded against the carrying value of both retained
interests and purchased benefi cial interest whenever it is determined that an
other-than-temporary impairment has occurred.
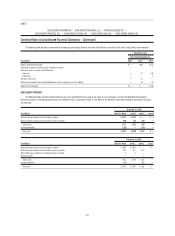
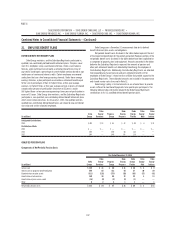
Key assumptions used in estimating fair value are detailed in the following table.
Duke Energy Ohio Duke Energy Indiana
2014 2013 2014 2013
Anticipated credit loss ratio 0.6% 0.6% 0.3% 0.3%
Discount rate 1.2% 1.2% 1.2% 1.2%
Receivable turnover rate 12.8% 12.8% 10.5% 10.3%