Duke Energy 2014 Annual Report Download - page 64
Download and view the complete annual report
Please find page 64 of the 2014 Duke Energy annual report below. You can navigate through the pages in the report by either clicking on the pages listed below, or by using the keyword search tool below to find specific information within the annual report.-
 1
1 -
2
-
3
-
4
-
5
-
6
-
7
-
8
-
9
-
10
-
11
-
12
-
13
-
14
-
15
-
16
-
17
-
18
-
19
-
20
-
21
-
22
-
23
-
24
-
25
-
26
-
27
-
28
-
29
-
30
-
31
-
32
-
33
-
34
-
35
-
36
-
37
-
38
-
39
-
40
-
41
-
42
-
43
-
44
-
45
-
46
-
47
-
48
-
49
-
50
-
51
-
52
-
53
-
 54
54 -
 55
55 -
 56
56 -
 57
57 -
 58
58 -
 59
59 -
 60
60 -
 61
61 -
 62
62 -
 63
63 -
 64
64 -
 65
65 -
 66
66 -
 67
67 -
 68
68 -
 69
69 -
 70
70 -
 71
71 -
 72
72 -
 73
73 -
 74
74 -
75
-
76
-
77
-
78
-
79
-
80
-
81
-
82
-
83
-
84
-
85
-
86
-
87
-
88
-
89
-
90
-
91
-
92
-
93
-
94
-
95
-
96
-
97
-
98
-
99
-
100
-
101
-
102
-
103
-
104
-
105
-
106
-
107
-
108
-
109
-
110
-
111
-
112
-
113
-
114
-
115
-
116
-
117
-
118
-
119
-
120
-
121
-
122
-
123
-
124
-
125
-
126
-
127
-
128
-
129
-
130
-
131
-
132
-
133
-
134
-
135
-
136
-
137
-
138
-
139
-
140
-
141
-
142
-
143
-
144
-
145
-
146
-
147
-
148
-
149
-
150
-
151
-
152
-
153
-
154
-
155
-
156
-
157
-
158
-
159
-
160
-
161
-
162
-
163
-
164
-
165
-
166
-
167
-
168
-
169
-
170
-
171
-
172
-
173
-
174
-
175
-
176
-
177
-
178
-
179
-
180
-
181
-
182
-
183
-
184
-
185
-
186
-
187
-
188
-
189
-
190
-
191
-
192
-
193
-
194
-
195
-
196
-
197
-
198
-
199
-
200
-
201
-
202
-
203
-
204
-
205
-
206
-
207
-
208
-
209
-
210
-
211
-
212
-
213
-
214
-
215
-
216
-
217
-
218
-
219
-
220
-
221
-
222
-
223
-
224
-
225
-
226
-
227
-
228
-
229
-
230
-
231
-
232
-
233
-
234
-
235
-
236
-
237
-
238
-
239
-
240
-
241
-
242
-
243
-
244
-
245
-
246
-
247
-
248
-
249
-
250
-
251
-
252
-
253
-
254
-
255
-
256
-
257
-
258
-
259
-
260
-
261
-
262
-
263
-
264
 |
 |

44
PART II
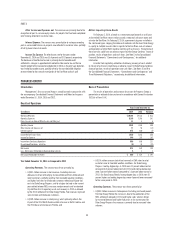
Partially offset by:
• A $346 million decrease due to 2013 impairment and other charges
primarily related to Crystal River Unit 3 and Levy; and
• A $48 million decrease in operations and maintenance costs primarily
due to prior year Crystal River Unit 3 related settlement matters and
lower costs associated with Progress Energy’s merger with Duke
Energy. These costs were partially offset by increased expenses that
are recoverable under the energy conservation and environmental cost
recovery clauses.
Other Income and Expense, net. The variance is driven by lower AFUDC
return on the Levy projects in the current year.
Interest Expense. The increase is due to a lower debt return in 2014
driven by the Crystal River Unit 3 regulatory asset impairment in 2013 and
accelerated Crystal River Unit 3 regulatory asset cost recovery in 2014 as
allowed by the 2013 Settlement.
Income Tax Expense. The variance was primarily due to an increase in
pretax income. The effective tax rate for the years ended December 31, 2014 and
2013 was 38.9 percent and 39.6 percent, respectively.
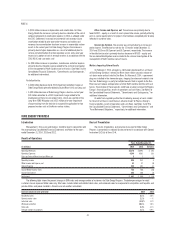
DUKE ENERGY OHIO
Introduction
Management’s Discussion and Analysis should be read in conjunction with
the accompanying Consolidated Financial Statements and Notes for the years
ended December 31, 2014, 2013 and 2012.
Basis of Presentation
The results of operations and variance discussion for Duke Energy Ohio is
presented in a reduced disclosure format in accordance with General Instruction
(I)(2)(a) of Form 10-K.
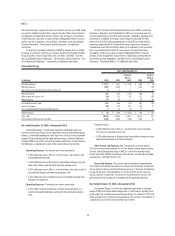
Results of Operations
Years Ended December 31,
(in millions) 2014 2013 Variance
Operating Revenues $1,913 $ 1,805 $ 108
Operating Expenses 1,727 1,627 100
Gains on Sales of Other Assets and Other, net 14 (3)
Operating Income 187 182 5
Other Income and Expense, net 10 28
Interest Expense 86 74 12
Income from Continuing Operations Before Income Taxes 111 110 1
Income Tax Expense from Continuing Operations 43 43 —
Income from Continuing Operations 68 67 1
(Loss) Income from Discontinued Operations, net of tax (563) 35 (598)
Net (Loss) Income $ (495) $ 102 $ (597)
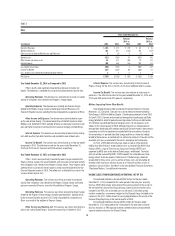
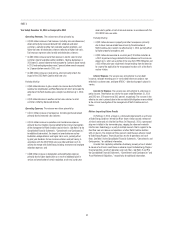
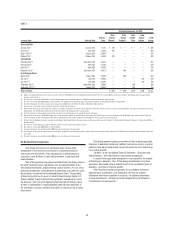
The following table shows the percent changes in Regulated Utilities’ GWh sales and average number of customers for Duke Energy Ohio. The below percentages
for retail customer classes represent billed sales only. Total sales includes billed and unbilled retail sales, and wholesale sales to incorporated municipalities and to
public and private utilities and power marketers. Amounts are not weather normalized.
Increase (decrease) over prior year 2014 2013
Residential sales 1.3% 1.5%
General service sales 0.8% 0.8%
Industrial sales 3.3% 0.2%
Wholesale power sales (24.9)% 20.9%
Total sales 0.7% 0.9%
Average number of customers 0.6% 0.4%
Year Ended December 31, 2014 as Compared to 2013
Operating Revenues. The variance was driven primarily by:
• A $56 million increase in regulated fuel revenues primarily driven by
higher fuel costs and increased sales volumes;
• A $51 million increase in retail pricing and rate riders primarily due to
2013 rate increases; and
• A $9 million increase in volumes to retail customers.
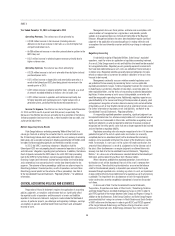
Partially offset by:
• An $8 million decrease in electric revenues for the Beckjord station
driven from lower production as units have been retired; and
• A $7 million decrease in net mark-to-market revenue on non-qualifying
power hedge contracts.
Operating Expenses. The variance was driven primarily by:
• A $94 million impairment taken related to OVEC. See Note 11 to the
Consolidated Financial Statements, “Goodwill and Intangible Assets” for
additional information; and