ICICI Bank 2010 Annual Report Download - page 98
Download and view the complete annual report
Please find page 98 of the 2010 ICICI Bank annual report below. You can navigate through the pages in the report by either clicking on the pages listed below, or by using the keyword search tool below to find specific information within the annual report.-
 1
1 -
2
-
3
-
4
-
5
-
6
-
7
-
8
-
9
-
10
-
11
-
12
-
13
-
14
-
15
-
16
-
17
-
18
-
19
-
20
-
21
-
22
-
23
-
24
-
25
-
26
-
27
-
28
-
29
-
30
-
31
-
32
-
33
-
34
-
35
-
36
-
37
-
38
-
39
-
40
-
41
-
42
-
43
-
44
-
45
-
46
-
47
-
48
-
49
-
50
-
51
-
52
-
53
-
54
-
55
-
56
-
57
-
58
-
59
-
60
-
61
-
62
-
63
-
64
-
65
-
66
-
67
-
68
-
69
-
70
-
71
-
72
-
73
-
74
-
75
-
76
-
77
-
78
-
79
-
80
-
81
-
82
-
83
-
84
-
85
-
86
-
87
-
 88
88 -
 89
89 -
 90
90 -
 91
91 -
 92
92 -
 93
93 -
 94
94 -
 95
95 -
 96
96 -
 97
97 -
 98
98 -
 99
99 -
 100
100 -
 101
101 -
 102
102 -
 103
103 -
 104
104 -
 105
105 -
 106
106 -
 107
107 -
 108
108 -
109
-
110
-
111
-
112
-
113
-
114
-
115
-
116
-
117
-
118
-
119
-
120
-
121
-
122
-
123
-
124
-
125
-
126
-
127
-
128
-
129
-
130
-
131
-
132
-
133
-
134
-
135
-
136
-
137
-
138
-
139
-
140
-
141
-
142
-
143
-
144
-
145
-
146
-
147
-
148
-
149
-
150
-
151
-
152
-
153
-
154
-
155
-
156
-
157
-
158
-
159
-
160
-
161
-
162
-
163
-
164
-
165
-
166
-
167
-
168
-
169
-
170
-
171
-
172
-
173
-
174
-
175
-
176
-
177
-
178
-
179
-
180
-
181
-
182
-
183
-
184
-
185
-
186
-
187
-
188
-
189
-
190
-
191
-
192
-
193
-
194
-
195
-
196
 |
 |

F18
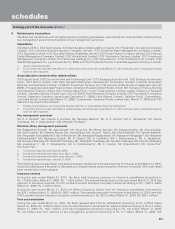
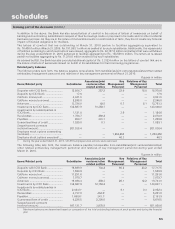
3. Information about business and geographical segments
Business Segments
Pursuant to the guidelines issued by RBI on Accounting Standard 17 – (Segment Reporting) – Enhancement of Disclosures
dated April 18, 2007, effective from year ended March 31, 2008, the following business segments have been reported.
z Retail Banking includes exposures which satisfy the four criteria of orientation, product, granularity and low value of
individual exposures for retail exposures laid down in Basel Committee on Banking Supervision document “International
Convergence of Capital Measurement and Capital Standards: A Revised Framework”.
z Wholesale Banking includes all advances to trusts, partnership firms, companies and statutory bodies, which are not
included under Retail Banking.
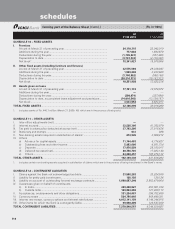
z Treasury includes the entire investment portfolio of the Bank.
z Other Banking includes hire purchase and leasing operations and other items not attributable to any particular business
segment.
Income, expenses, assets and liabilities are either specifically identified with individual segments or are allocated to segments
on a systematic basis.
All liabilities are transfer priced to a central treasury unit, which pools all funds and lends to the business units at appropriate
rates based on the relevant maturity of assets being funded after adjusting for regulatory reserve requirements.
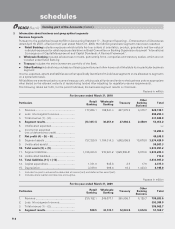
The following tables set forth, for the period indicated, the business segment results on this basis.
Rupees in million
For the year ended March 31, 2010
Particulars Retail
Banking Wholesale
Banking Treasury Other
Banking
Business Total
1. Revenue ..................................................... 177,244.1 192,541.3 247,978.0 4,375.7 622,139.1
2. Less: Inter-segment revenue ..................... 290,293.3
3. Total revenue (1) – (2) ................................. 331,845.8
4. Segment results ........................................ (13,335.1) 36,451.0 27,886.4 2,450.9 53,453.2
5. Unallocated expenses ................................ —
6. Income tax expenses
(net of deferred tax credit) ......................... 13,203.4
7. Net profit (4) – (5) – (6) ............................. 40,249.8
8. Segment assets ......................................... 737,339.9 1,184,314.3 1,642,098.9 10,676.8 3,574,429.9
9. Unallocated assets1 .................................... 59,567.3
10. Total assets (8) + (9) ................................ 3,633,997.2
11. Segment liabilities ...................................... 1,186,393.0 915,021.2 1,525,898.625,970.5 3,633,283.3
12. Unallocated liabilities ................................. 713.9
13. Total liabilities (11) + (12) ........................ 3,633,997.2
14. Capital expenditure .................................... 1,721.0 635.8 2.9 17.6 2,377.3
15. Depreciation ............................................... 3,749.0 996.4 16.3 1,433.3 6,195.0
1. Includes tax paid in advance/tax deducted at source (net) and deferred tax asset (net).
2. Includes share capital and reserves and surplus.
Rupees in million
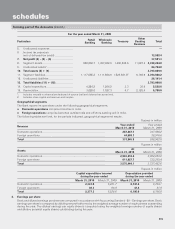
For the year ended March 31, 2009
Particulars Retail
Banking Wholesale
Banking Treasury Other
Banking
Business Total
1. Revenue ..................................................... 230,152.1 248,077.1 295,908.7 6,125.7 780,263.6
2. Less: Inter-segment revenue ..................... 393,300.9
3. Total revenue (1) – (2) ................................. 386,962.7
4. Segment results ........................................ 580.5 34,133.1 12,843.5 3,612.6 51,169.7
schedules
forming part of the Accounts (Contd.)