ICICI Bank 2010 Annual Report Download - page 66
Download and view the complete annual report
Please find page 66 of the 2010 ICICI Bank annual report below. You can navigate through the pages in the report by either clicking on the pages listed below, or by using the keyword search tool below to find specific information within the annual report.-
 1
1 -
2
-
3
-
4
-
5
-
6
-
7
-
8
-
9
-
10
-
11
-
12
-
13
-
14
-
15
-
16
-
17
-
18
-
19
-
20
-
21
-
22
-
23
-
24
-
25
-
26
-
27
-
28
-
29
-
30
-
31
-
32
-
33
-
34
-
35
-
36
-
37
-
38
-
39
-
40
-
41
-
42
-
43
-
44
-
45
-
46
-
47
-
48
-
49
-
50
-
51
-
52
-
53
-
54
-
55
-
 56
56 -
 57
57 -
 58
58 -
 59
59 -
 60
60 -
 61
61 -
 62
62 -
 63
63 -
 64
64 -
 65
65 -
 66
66 -
 67
67 -
 68
68 -
 69
69 -
 70
70 -
 71
71 -
 72
72 -
 73
73 -
 74
74 -
 75
75 -
 76
76 -
77
-
78
-
79
-
80
-
81
-
82
-
83
-
84
-
85
-
86
-
87
-
88
-
89
-
90
-
91
-
92
-
93
-
94
-
95
-
96
-
97
-
98
-
99
-
100
-
101
-
102
-
103
-
104
-
105
-
106
-
107
-
108
-
109
-
110
-
111
-
112
-
113
-
114
-
115
-
116
-
117
-
118
-
119
-
120
-
121
-
122
-
123
-
124
-
125
-
126
-
127
-
128
-
129
-
130
-
131
-
132
-
133
-
134
-
135
-
136
-
137
-
138
-
139
-
140
-
141
-
142
-
143
-
144
-
145
-
146
-
147
-
148
-
149
-
150
-
151
-
152
-
153
-
154
-
155
-
156
-
157
-
158
-
159
-
160
-
161
-
162
-
163
-
164
-
165
-
166
-
167
-
168
-
169
-
170
-
171
-
172
-
173
-
174
-
175
-
176
-
177
-
178
-
179
-
180
-
181
-
182
-
183
-
184
-
185
-
186
-
187
-
188
-
189
-
190
-
191
-
192
-
193
-
194
-
195
-
196
 |
 |

Management’s Discussion and Analysis
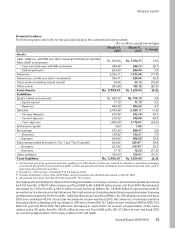
At year-end fiscal 2010, the gross non-performing assets (net of write-offs, interest suspense and derivatives income
reversal) were Rs. 96.27 billion compared to Rs. 98.03 billion at year-end fiscal 2009. Net non-performing assets
were Rs. 39.01 billion at year-end fiscal 2010 compared to Rs. 46.19 billion at year-end fiscal 2009. The ratio of net
non-performing assets to net customer assets decreased from 1.96% at year-end fiscal 2009 to 1.87% at year-end
fiscal 2010. During the fiscal 2010, we wrote-off NPAs, including retail NPAs, with an aggregate outstanding of
Rs. 28.48 billion. These NPAs were fully provided for at the time of the write-off.
Our provision coverage ratio (i.e. total provisions made against non-performing assets as a percentage of gross
non-performing assets), at year-end fiscal 2010 was 59.5%. RBI guidelines require banks to achieve a provision
coverage ratio of 70% by September 30, 2010. We have been permitted by RBI to achieve the stipulated level of
provision coverage ratio of 70% in a phased manner by March 31, 2011. At year-end fiscal 2010, total general
provision held against standard assets was Rs. 14.36 billion against the requirement of Rs. 7.30 billion. The excess
provision was not reversed in line with the RBI guidelines.
The increased level of non-performing assets was due to higher level of non-performing assets in the retail assets
portfolio. Provisions against retail non performing loans increased due to seasoning of the secured loan portfolio,
losses on the unsecured loan portfolio, challenges in collections and the impact of the adverse macro-economic
environment experienced in fiscal 2009. At year-end fiscal 2010, the net non-performing loans in the retail portfolio
were 3.05% of net retail loans as compared with 2.94% at year-end fiscal 2009. The increase in the ratio was
primarily on account of the overall decline in our retail loans during fiscal 2009 and fiscal 2010. At year-end fiscal
2010, the net non-performing loans in the collateralised retail portfolio were 1.92% of the net collateralised retail
loans and net non-performing loans in the non-collateralised retail portfolio (including overdraft financing against
automobiles) were about 12.00% of net non-collateralised retail loans.
Our aggregate investments in security receipts issued by asset reconstruction companies were Rs. 33.94 billion
at year-end fiscal 2010.
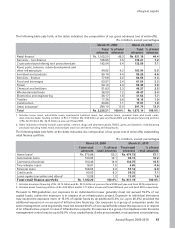
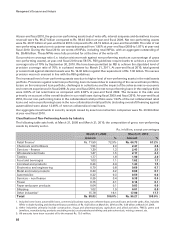
Classification of Non-Performing Assets by Industry
The following table sets forth, at March 31, 2009 and March 31, 2010, the composition of gross non-performing
assets by industry sector.
Rs. in billion, except percentages
March 31, 2009 March 31, 2010
Amount % Amount %
Retail finance1Rs. 71.50 72.9% Rs. 64.73 67.2%
Chemicals and fertilisers 1.96 2.0 2.47 2.6
Services – finance 1.29 1.3 2.43 2.5
Wholesale/retail trade 1.47 1.5 2.17 2.3
Textiles 1.77 1.8 1.90 2.0
Food and beverages 1.03 1.1 1.62 1.7
Iron/steel and products 0.36 0.4 1.43 1.5
Electronics and engineering 0.79 0.8 0.69 0.7
Metal and metal products 0.20 0.2 0.68 0.7
Automobiles 0.32 0.3 0.59 0.6
Services – non finance 0.35 0.4 0.38 0.4
Power 0.15 0.1 0.14 0.1
Paper and paper products 0.04 0.1 0.03 0.0
Shipping 1.02 1.0 0.01 0.0
Other Industries215.78 16.1 17.00 17.7
Total Rs. 98.03 100.0% Rs. 96.27 100.0%
1. Includes home loans, automobile loans, commercial business loans, two wheeler loans, personal loans and credit cards. Also, includes
NPAs in dealer funding and developer finance portfolios of Rs. 0.42 billion at March 31, 2010 and Rs. 0.44 billion at March 31, 2009.
2. Other industries primarily include construction, drugs and pharmaceuticals, agriculture and allied activities, FMCG, gems and
jewellery, manufacturing products excluding metal, crude petroleum/refining and petrochemicals, mining, cement, etc.
3. All amounts have been rounded off to the nearest Rs. 10.0 million.
64