ICICI Bank 2010 Annual Report Download - page 115
Download and view the complete annual report
Please find page 115 of the 2010 ICICI Bank annual report below. You can navigate through the pages in the report by either clicking on the pages listed below, or by using the keyword search tool below to find specific information within the annual report.-
 1
1 -
2
-
3
-
4
-
5
-
6
-
7
-
8
-
9
-
10
-
11
-
12
-
13
-
14
-
15
-
16
-
17
-
18
-
19
-
20
-
21
-
22
-
23
-
24
-
25
-
26
-
27
-
28
-
29
-
30
-
31
-
32
-
33
-
34
-
35
-
36
-
37
-
38
-
39
-
40
-
41
-
42
-
43
-
44
-
45
-
46
-
47
-
48
-
49
-
50
-
51
-
52
-
53
-
54
-
55
-
56
-
57
-
58
-
59
-
60
-
61
-
62
-
63
-
64
-
65
-
66
-
67
-
68
-
69
-
70
-
71
-
72
-
73
-
74
-
75
-
76
-
77
-
78
-
79
-
80
-
81
-
82
-
83
-
84
-
85
-
86
-
87
-
88
-
89
-
90
-
91
-
92
-
93
-
94
-
95
-
96
-
97
-
98
-
99
-
100
-
101
-
102
-
103
-
104
-
 105
105 -
 106
106 -
 107
107 -
 108
108 -
 109
109 -
 110
110 -
 111
111 -
 112
112 -
 113
113 -
 114
114 -
 115
115 -
 116
116 -
 117
117 -
 118
118 -
 119
119 -
 120
120 -
 121
121 -
 122
122 -
 123
123 -
 124
124 -
 125
125 -
126
-
127
-
128
-
129
-
130
-
131
-
132
-
133
-
134
-
135
-
136
-
137
-
138
-
139
-
140
-
141
-
142
-
143
-
144
-
145
-
146
-
147
-
148
-
149
-
150
-
151
-
152
-
153
-
154
-
155
-
156
-
157
-
158
-
159
-
160
-
161
-
162
-
163
-
164
-
165
-
166
-
167
-
168
-
169
-
170
-
171
-
172
-
173
-
174
-
175
-
176
-
177
-
178
-
179
-
180
-
181
-
182
-
183
-
184
-
185
-
186
-
187
-
188
-
189
-
190
-
191
-
192
-
193
-
194
-
195
-
196
 |
 |

F35
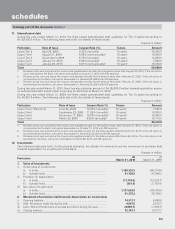
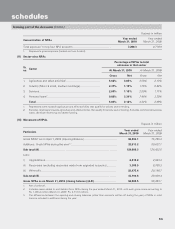
18. Details of Single Borrower Limit and Borrower Group Limit exceeded by the Bank
During the year ended March 31, 2010, the Bank’s exposure to any single borrower and borrower group were within the
limits prescribed by RBI except in the cases of Reliance Industries Limited, Barclays Bank PLC and ICICI Prudential Flexible
Income Plan where exposures to single borrowers were above the stipulated ceiling of 15.0% of capital funds. At March 31,
2010, the exposure to these borrowers as percentage of capital funds was: Reliance Industries Limited: 15.7%, Barclays
Bank PLC: 10.7% and ICICI Prudential Flexible Income Plan: 5.4%.
The excess exposure in the above cases were duly approved/confirmed by the Board of Directors of the Bank with exposures
being within 20.0% of Bank’s capital funds in accordance with the guidelines issued by RBI.
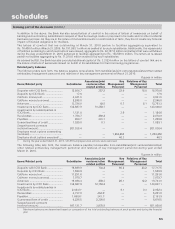
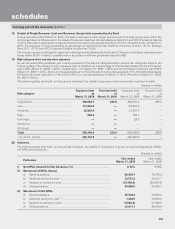
19. Risk category-wise country-wise exposure
As per the extant RBI guidelines, the country exposure of the Bank is categorised into various risk categories listed in the
following table. The funded country exposure (net) of the Bank as a percentage of total funded assets for United Kingdom
was 1.44% (March 31, 2009: 1.22%), Canada was 1.11% (March 31, 2009: 1.05%) and United States of America was 0.66%
(March 31, 2009: 1.34%). As the net funded exposure to United Kingdom and Canada exceeds 1.0% of total funded assets,
the Bank has made a provision of Rs. 235.0 million on country exposures at March 31, 2010 (Provision at March 31, 2009:
Rs. 285.0 million).
The following table sets forth, for the periods indicated, the details of exposure (net) and provision held by the bank.
Rupees in million
Risk category Exposure (net)
at
March 31, 2010
Provision held
at
March 31, 2010
Exposure (net)
at
March 31, 2009
Provision held
at
March 31, 2009
Insignificant ..................................................... 392,684.7 235.0 442,570.4 285.0
Low .................................................................. 131,940.9 — 172,910.8 —
Moderate ......................................................... 25,024.4 — 21,870.7 —
High ................................................................. 696.4 — 784.1 —
Very High ......................................................... ——22.8 —
Restricted ........................................................ ————
Off-Credit ......................................................... ————
Total ................................................................ 550,346.4 235.0 638,158.8 285.0
– Of which: funded ......................................... 245,144.8 — 289,482.0 —
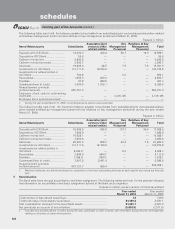
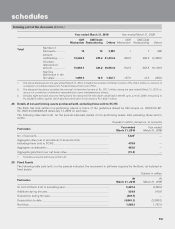
20. Advances
The following table sets forth, for the periods indicated, the details of movement of gross non performing assets (NPAs),
net NPAs and provisions.
Rupees in million
Particulars Year ended
March 31, 2010 Year ended
March 31, 2009
i) Net NPAs (funded) to Net Advances (%) .................................................. 2.12% 2.09%
ii) Movement of NPAs (Gross)
a) Opening balance .................................................................................. 96,493.1 75,795.4
b) Additions during the year1, 2 ................................................................. 32,513.2 50,637.1
c) Reductions during the year1 ................................................................. (34,199.8) (29,939.4)
d) Closing balance .................................................................................... 94,806.5 96,493.1
iii) Movement of Net NPAs
a) Opening balance .................................................................................. 45,539.4 34,905.5
b) Additions during the year1, 2 ................................................................. 1,452.5 19,824.5
c) Reductions during the year1 ................................................................. (8,580.8) (9,190.6)
d) Closing balance .................................................................................... 38,411.1 45,539.4
schedules
forming part of the Accounts (Contd.)