ICICI Bank 2010 Annual Report Download - page 58
Download and view the complete annual report
Please find page 58 of the 2010 ICICI Bank annual report below. You can navigate through the pages in the report by either clicking on the pages listed below, or by using the keyword search tool below to find specific information within the annual report.-
 1
1 -
2
-
3
-
4
-
5
-
6
-
7
-
8
-
9
-
10
-
11
-
12
-
13
-
14
-
15
-
16
-
17
-
18
-
19
-
20
-
21
-
22
-
23
-
24
-
25
-
26
-
27
-
28
-
29
-
30
-
31
-
32
-
33
-
34
-
35
-
36
-
37
-
38
-
39
-
40
-
41
-
42
-
43
-
44
-
45
-
46
-
47
-
 48
48 -
 49
49 -
 50
50 -
 51
51 -
 52
52 -
 53
53 -
 54
54 -
 55
55 -
 56
56 -
 57
57 -
 58
58 -
 59
59 -
 60
60 -
 61
61 -
 62
62 -
 63
63 -
 64
64 -
 65
65 -
 66
66 -
 67
67 -
 68
68 -
69
-
70
-
71
-
72
-
73
-
74
-
75
-
76
-
77
-
78
-
79
-
80
-
81
-
82
-
83
-
84
-
85
-
86
-
87
-
88
-
89
-
90
-
91
-
92
-
93
-
94
-
95
-
96
-
97
-
98
-
99
-
100
-
101
-
102
-
103
-
104
-
105
-
106
-
107
-
108
-
109
-
110
-
111
-
112
-
113
-
114
-
115
-
116
-
117
-
118
-
119
-
120
-
121
-
122
-
123
-
124
-
125
-
126
-
127
-
128
-
129
-
130
-
131
-
132
-
133
-
134
-
135
-
136
-
137
-
138
-
139
-
140
-
141
-
142
-
143
-
144
-
145
-
146
-
147
-
148
-
149
-
150
-
151
-
152
-
153
-
154
-
155
-
156
-
157
-
158
-
159
-
160
-
161
-
162
-
163
-
164
-
165
-
166
-
167
-
168
-
169
-
170
-
171
-
172
-
173
-
174
-
175
-
176
-
177
-
178
-
179
-
180
-
181
-
182
-
183
-
184
-
185
-
186
-
187
-
188
-
189
-
190
-
191
-
192
-
193
-
194
-
195
-
196
 |
 |
Management’s Discussion and Analysis
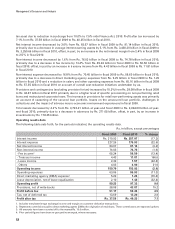
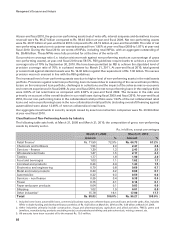
Total non-interest expense decreased by 16.8% from Rs. 70.45 billion in fiscal 2009 to Rs. 58.60 billion in
fiscal 2010 primarily due to a 17.5% decrease in other administrative expenses and 76.4% decrease in direct
marketing agency expenses.
Other administrative expenses decreased by 17.5% from Rs. 38.64 billion in fiscal 2009 to Rs. 31.87 billion in
fiscal 2010 primarily due to overall cost reduction initiatives undertaken by us. There was a reduction in expenses
on account of printing and stationery, advertisement and publicity and postage and communication expenses
in fiscal 2010 as compared to fiscal 2009.
Employee expenses decreased by 2.3% from Rs. 19.72 billion in fiscal 2009 to Rs. 19.26 billion in fiscal 2010
despite the provision of performance bonus and performance-linked retention pay in fiscal 2010. The decrease
in employee expenses was primarily due to a decrease in the average employee base. Though the average
employee base was lower in fiscal 2010, the employee base at year-end fiscal 2010 was marginally higher at
35,256 as compared to 34,596 at year-end fiscal 2009.
Depreciation on owned property increased by 2.1% from Rs. 4.68 billion in fiscal 2009 to Rs. 4.78 billion in fiscal
2010, primarily due to the addition of new branches. The number of branches and extension counters in India
increased from 1,419 at year-end fiscal 2009 to 1,707 at year-end fiscal 2010. The number of ATMs increased
from 4,713 at year-end fiscal 2009 to 5,219 at year-end fiscal 2010. Depreciation on leased assets decreased
by 32.4% from Rs. 2.10 billion in fiscal 2009 to Rs. 1.42 billion in fiscal 2010.
We use marketing agents, called direct marketing agents or associates, for sourcing our retail assets. We
include commissions paid to these direct marketing agents of our retail assets in non-interest expense. These
commissions are expensed upfront and not amortised over the life of the loan. Due to lower retail disbursements
and lower issuance of new credit cards, direct marketing agency expenses decreased by 76.4% from Rs. 5.29
billion in fiscal 2009 to Rs. 1.25 billion in fiscal 2010.
Provisions and tax
Provisions and contingencies (excluding provision for tax) increased by 15.2% from Rs. 38.08 billion in fiscal
2009 to Rs. 43.87 billion in fiscal 2010, due to a higher level of provisioning for retail non performing loans
and an increase in provisions for restructured corporate assets. Provisions for retail non-performing loans
increased due to seasoning of the secured loan portfolio, losses on the unsecured loan portfolio, challenges
in collections and the impact of adverse macro-economic environment experienced in fiscal 2009.
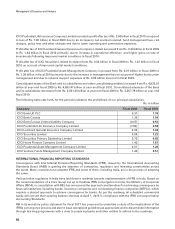
Our provision coverage ratio (i.e. total provisions made against non-performing advances as a percentage of
gross non-performing advances), at year-end fiscal 2010 was 59.5%. RBI guidelines require banks to achieve
a provision coverage ratio of 70% by September 30, 2010. We have been permitted by RBI to achieve the
stipulated level of provision coverage ratio of 70% in a phased manner by March 31, 2011.
At March 31, 2010, we held a provision of Rs. 14.36 billion towards provision for standard assets against the
requirement of Rs. 7.30 billion. The excess provision was not reversed in line with the RBI guidelines.
Income tax expense decreased by 2.9% from Rs. 13.59 billion in fiscal 2009 to Rs. 13.20 billion in fiscal 2010.
The effective tax rate of 24.7% in fiscal 2010 was lower compared to the effective tax rate of 26.6% in fiscal 2009
primarily due to a change in the mix of taxable profits with a higher component of exempt income, abolition
of fringe benefit tax, offset, in part, by a negative impact of revaluation of deferred tax asset due to reduction in
surcharge from 10.0% to 7.5% vide Finance Act, 2010.
56