ICICI Bank 2010 Annual Report Download - page 63
Download and view the complete annual report
Please find page 63 of the 2010 ICICI Bank annual report below. You can navigate through the pages in the report by either clicking on the pages listed below, or by using the keyword search tool below to find specific information within the annual report.-
 1
1 -
2
-
3
-
4
-
5
-
6
-
7
-
8
-
9
-
10
-
11
-
12
-
13
-
14
-
15
-
16
-
17
-
18
-
19
-
20
-
21
-
22
-
23
-
24
-
25
-
26
-
27
-
28
-
29
-
30
-
31
-
32
-
33
-
34
-
35
-
36
-
37
-
38
-
39
-
40
-
41
-
42
-
43
-
44
-
45
-
46
-
47
-
48
-
49
-
50
-
51
-
52
-
 53
53 -
 54
54 -
 55
55 -
 56
56 -
 57
57 -
 58
58 -
 59
59 -
 60
60 -
 61
61 -
 62
62 -
 63
63 -
 64
64 -
 65
65 -
 66
66 -
 67
67 -
 68
68 -
 69
69 -
 70
70 -
 71
71 -
 72
72 -
 73
73 -
74
-
75
-
76
-
77
-
78
-
79
-
80
-
81
-
82
-
83
-
84
-
85
-
86
-
87
-
88
-
89
-
90
-
91
-
92
-
93
-
94
-
95
-
96
-
97
-
98
-
99
-
100
-
101
-
102
-
103
-
104
-
105
-
106
-
107
-
108
-
109
-
110
-
111
-
112
-
113
-
114
-
115
-
116
-
117
-
118
-
119
-
120
-
121
-
122
-
123
-
124
-
125
-
126
-
127
-
128
-
129
-
130
-
131
-
132
-
133
-
134
-
135
-
136
-
137
-
138
-
139
-
140
-
141
-
142
-
143
-
144
-
145
-
146
-
147
-
148
-
149
-
150
-
151
-
152
-
153
-
154
-
155
-
156
-
157
-
158
-
159
-
160
-
161
-
162
-
163
-
164
-
165
-
166
-
167
-
168
-
169
-
170
-
171
-
172
-
173
-
174
-
175
-
176
-
177
-
178
-
179
-
180
-
181
-
182
-
183
-
184
-
185
-
186
-
187
-
188
-
189
-
190
-
191
-
192
-
193
-
194
-
195
-
196
 |
 |

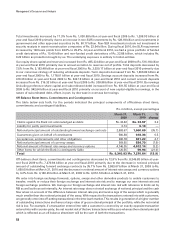
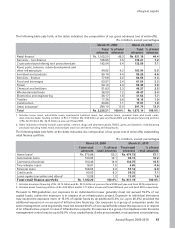
The following table sets forth, at the dates indicated, the composition of our gross advances (net of write-offs).
Rs. in billion, except percentages
March 31, 2009 March 31, 2010
Total
advances % of total
advances Total
advances % of total
advances
Retail finance1 Rs. 1,102.20 49.3 Rs. 831.19 44.4
Services – non-finance 168.05 7.5 135.21 7.2
Crude petroleum/refining and petrochemicals 142.04 6.4 132.86 7.1
Road, ports, telecom, urban development and
other infrastructure 94.62 4.2 103.94 5.5
Iron/steel and products 99.14 4.4 86.26 4.6
Services – finance 77.68 3.5 64.56 3.4
Food and beverages 53.57 2.4 61.54 3.3
Power 54.19 2.4 56.49 3.0
Chemical and fertilizers 51.83 2.3 46.27 2.5
Wholesale/retail trade 26.29 1.2 44.47 2.4
Electronics and engineering 36.17 1.6 31.54 1.7
Textiles 17.38 0.8 19.16 1.0
Construction 23.86 1.1 17.91 1.0
Other industries2 289.19 12.9 241.74 12.9
Total Rs. 2,236.21 100.0% Rs. 1,873.14 100.0%
1. Includes home loans, automobile loans, commercial business loans, two wheeler loans, personal loans and credit cards.
Also includes dealer funding portfolio of Rs 7.71 billion (Rs. 8.83 billion at year-end fiscal 2009) and developer financing portfolio
of Rs. 32.76 billion (Rs. 24.14 billion at year-end fiscal 2009).
2. Other industries primarily include automobiles, cement, drugs and pharmaceuticals, FMCG, gems and jewellery, manufacturing
products excluding metal, metal and products (excl iron and steel), mining and shipping etc.
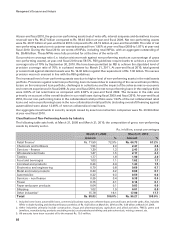
The following table sets forth, at the dates indicated, the composition of our gross (net of write-offs) outstanding
retail finance portfolio.
Rs. in billion, except percentages
March 31, 2009 March 31, 2010
Total retail
advances % of total
retail advances Total retail
advances % of total
retail advances
Home loans1Rs. 575.88 52.2 Rs. 474.72 57.1
Automobile loans 133.05 12.1 85.13 10.2
Commercial business 164.40 14.9 136.75 16.5
Two-wheeler loans 16.91 1.5 4.65 0.6
Personal loans 108.66 9.9 57.14 6.9
Credit cards 90.02 8.2 59.33 7.1
Loans against securities and others213.28 1.2 13.47 1.6
Total retail finance portfolio Rs. 1,102.20 100.0% Rs. 831.19 100.0%
1. Includes developer financing of Rs. 24.14 billion and Rs. 32.76 billion at year-end fiscal 2009 and year-end fiscal 2010 respectively.
2. Includes dealer financing portfolio of Rs. 8.83 billion and Rs 7.71 billion at year-end fiscal 2009 and year-end fiscal 2010 respectively.
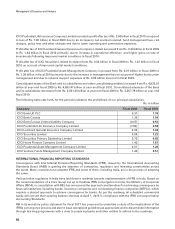
Pursuant to RBI guidelines, our exposure to an individual borrower generally must not exceed 15.0% of our
capital funds, unless the exposure is in respect of an infrastructure project. Exposure to individual borrowers
may exceed the exposure norm of 15.0% of capital funds by an additional 5.0% (i.e. up to 20.0%) provided the
additional exposure is on account of infrastructure financing. Our exposure to a group of companies under the
same management control generally must not exceed 40.0% of our capital funds unless the exposure is in respect
of an infrastructure project. In case of infrastructure projects, the exposure to a group of companies under the same
management control may be up to 50.0% of our capital funds. Banks are permitted, in exceptional circumstances,
61
Annual Report 2009-2010
khayaal aapka