ICICI Bank 2010 Annual Report Download - page 139
Download and view the complete annual report
Please find page 139 of the 2010 ICICI Bank annual report below. You can navigate through the pages in the report by either clicking on the pages listed below, or by using the keyword search tool below to find specific information within the annual report.-
 1
1 -
2
-
3
-
4
-
5
-
6
-
7
-
8
-
9
-
10
-
11
-
12
-
13
-
14
-
15
-
16
-
17
-
18
-
19
-
20
-
21
-
22
-
23
-
24
-
25
-
26
-
27
-
28
-
29
-
30
-
31
-
32
-
33
-
34
-
35
-
36
-
37
-
38
-
39
-
40
-
41
-
42
-
43
-
44
-
45
-
46
-
47
-
48
-
49
-
50
-
51
-
52
-
53
-
54
-
55
-
56
-
57
-
58
-
59
-
60
-
61
-
62
-
63
-
64
-
65
-
66
-
67
-
68
-
69
-
70
-
71
-
72
-
73
-
74
-
75
-
76
-
77
-
78
-
79
-
80
-
81
-
82
-
83
-
84
-
85
-
86
-
87
-
88
-
89
-
90
-
91
-
92
-
93
-
94
-
95
-
96
-
97
-
98
-
99
-
100
-
101
-
102
-
103
-
104
-
105
-
106
-
107
-
108
-
109
-
110
-
111
-
112
-
113
-
114
-
115
-
116
-
117
-
118
-
119
-
120
-
121
-
122
-
123
-
124
-
125
-
126
-
127
-
128
-
 129
129 -
 130
130 -
 131
131 -
 132
132 -
 133
133 -
 134
134 -
 135
135 -
 136
136 -
 137
137 -
 138
138 -
 139
139 -
 140
140 -
 141
141 -
 142
142 -
 143
143 -
 144
144 -
 145
145 -
 146
146 -
 147
147 -
 148
148 -
 149
149 -
150
-
151
-
152
-
153
-
154
-
155
-
156
-
157
-
158
-
159
-
160
-
161
-
162
-
163
-
164
-
165
-
166
-
167
-
168
-
169
-
170
-
171
-
172
-
173
-
174
-
175
-
176
-
177
-
178
-
179
-
180
-
181
-
182
-
183
-
184
-
185
-
186
-
187
-
188
-
189
-
190
-
191
-
192
-
193
-
194
-
195
-
196
 |
 |

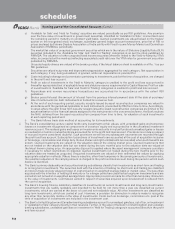
F59
schedules
(Rs. in ‘000s)
forming part of the Consolidated Balance Sheet (Contd.)
At
31.03.2010 At
31.03.2009
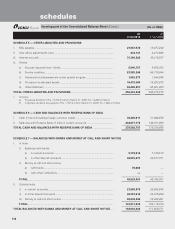
SCHEDULE 8 — INVESTMENTS
I. Investments in India (net of provisions)
i) Government securities .............................................................................................. 732,093,813 682,931,198
ii) Other approved securities ........................................................................................ 45,009 93,405
iii) Shares (includes equity and preference shares)1 ................................................. 42,426,779 29,708,664
iv) Debentures and bonds ............................................................................................. 75,752,082 52,956,402
v) Assets held to cover linked liabilities of life insurance business ...................... 514,692,566 286,139,525
vi) Others (commercial paper, mutual fund units, pass through certificates,
security receipts, certificate of deposits etc.) ...................................................... 337,886,043 216,658,105
TOTAL INVESTMENTS IN INDIA 1,702,896,292 1,268,487,299
II. Investments outside India (net of provisions)
i) Government securities .............................................................................................. 38,707,855 4,525,830
ii) Others ........................................................................................................................... 121,593,693 208,056,900
TOTAL INVESTMENTS OUTSIDE INDIA ...................................................................... 160,301,548 212,582,730
TOTAL INVESTMENTS .............................................................................................................. 1,863,197,840 1,481,070,029
III. Investments in India
Gross value of investments2.............................................................................................. 1,718,296,361 1,290,031,307
Less: Aggregate of provision/depreciation/(appreciation) ......................................... 15,400,069 21,544,008
Net investments................................................................................................................... 1,702,896,292 1,268,487,299
IV. Investments outside India
Gross value of investments ............................................................................................... 164,916,920 234,903,006
Less: Aggregate of provision/depreciation/(appreciation) .......................................... 4,615,372 22,320,276
Net investments ................................................................................................................. 160,301,548 212,582,730
TOTAL INVESTMENTS 1,863,197,840 1,481,070,029
1. Includes acquisition cost of investment in associates of Rs. 524.5 million (March 31, 2009: Rs. 459.2 million).
2. Includes appreciation of Rs. 93,112.5 million (net of depreciation, March 31, 2009: Rs. 36,369.6 million) on investments held to cover
linked liabilities of life insurance business.
SCHEDULE 9 — ADVANCES (net of provisions)
A. i) Bills purchased and discounted .............................................................................. 47,219,427 40,915,231
ii) Cash credits, overdrafts and loans repayable on demand ................................. 260,401,668 350,610,312
iii) Term loans ................................................................................................................... 1,842,337,233 2,167,574,693
iv) Securitisation, finance lease and hire purchase receivables ............................. 107,822,952 102,204,423
TOTAL ADVANCES ............................................................................................................ 2,257,781,280 2,661,304,659
B. i) Secured by tangible assets [includes advances against book debts] ............. 1,612,468,494 2,009,647,889
ii) Covered by bank/government guarantees ............................................................ 21,202,426 14,815,009
iii) Unsecured .................................................................................................................... 624,110,360 636,841,761
TOTAL ADVANCES 2,257,781,280 2,661,304,659
C. I. Advances in India
i) Priority sector ..................................................................................................... 539,773,871 620,515,976
ii) Public sector ....................................................................................................... 3,201,088 3,494,486
iii) Banks.................................................................................................................... 41,790 252,580
iv) Others .................................................................................................................. 916,388,589 1,112,523,081
TOTAL ADVANCES IN INDIA 1,459,405,338 1,736,786,123
II. Advances outside India
i) Due from banks ................................................................................................. 13,649,907 16,618,624
ii) Due from others
a) Bills purchased and discounted ............................................................ 17,747,632 14,069,137
b) Commercial loans ..................................................................................... 349,421,101 419,791,632
c) Others ......................................................................................................... 417,557,302 474,039,143
TOTAL ADVANCES OUTSIDE INDIA ............................................................................ 798,375,942 924,518,536
TOTAL ADVANCES ............................................................................................................ 2,257,781,280 2,661,304,659