ICICI Bank 2010 Annual Report Download - page 28
Download and view the complete annual report
Please find page 28 of the 2010 ICICI Bank annual report below. You can navigate through the pages in the report by either clicking on the pages listed below, or by using the keyword search tool below to find specific information within the annual report.-
 1
1 -
2
-
3
-
4
-
5
-
6
-
7
-
8
-
9
-
10
-
11
-
12
-
13
-
14
-
15
-
16
-
17
-
 18
18 -
 19
19 -
 20
20 -
 21
21 -
 22
22 -
 23
23 -
 24
24 -
 25
25 -
 26
26 -
 27
27 -
 28
28 -
 29
29 -
 30
30 -
 31
31 -
 32
32 -
 33
33 -
 34
34 -
 35
35 -
 36
36 -
 37
37 -
 38
38 -
39
-
40
-
41
-
42
-
43
-
44
-
45
-
46
-
47
-
48
-
49
-
50
-
51
-
52
-
53
-
54
-
55
-
56
-
57
-
58
-
59
-
60
-
61
-
62
-
63
-
64
-
65
-
66
-
67
-
68
-
69
-
70
-
71
-
72
-
73
-
74
-
75
-
76
-
77
-
78
-
79
-
80
-
81
-
82
-
83
-
84
-
85
-
86
-
87
-
88
-
89
-
90
-
91
-
92
-
93
-
94
-
95
-
96
-
97
-
98
-
99
-
100
-
101
-
102
-
103
-
104
-
105
-
106
-
107
-
108
-
109
-
110
-
111
-
112
-
113
-
114
-
115
-
116
-
117
-
118
-
119
-
120
-
121
-
122
-
123
-
124
-
125
-
126
-
127
-
128
-
129
-
130
-
131
-
132
-
133
-
134
-
135
-
136
-
137
-
138
-
139
-
140
-
141
-
142
-
143
-
144
-
145
-
146
-
147
-
148
-
149
-
150
-
151
-
152
-
153
-
154
-
155
-
156
-
157
-
158
-
159
-
160
-
161
-
162
-
163
-
164
-
165
-
166
-
167
-
168
-
169
-
170
-
171
-
172
-
173
-
174
-
175
-
176
-
177
-
178
-
179
-
180
-
181
-
182
-
183
-
184
-
185
-
186
-
187
-
188
-
189
-
190
-
191
-
192
-
193
-
194
-
195
-
196
 |
 |

Directors’ Report
26
The Management’s Discussion & Analysis forms part of the Annual Report.
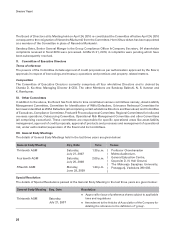
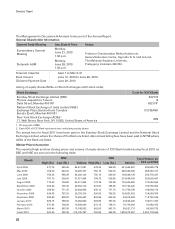
General Shareholder Information
General Body Meeting Day, Date & Time Venue
Extraordinary General
Meeting
Monday,
June 21, 2010
1.30 p.m. Professor Chandravadan Mehta Auditorium,
General Education Centre, Opposite D. N. Hall Ground,
The Maharaja Sayajirao University,
Pratapgunj, Vadodara 390 002.
Sixteenth AGM
Monday,
June 28, 2010
1.30 p.m
Financial Calendar : April 1 to March 31
Book Closure : June 12, 2010 to June 28, 2010
Dividend Payment Date : June 29, 2010
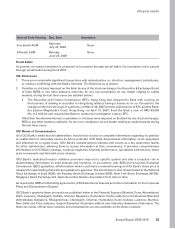
Listing of equity shares/ADSs on Stock Exchanges (with stock code)
Stock Exchange Code for ICICI Bank
Bombay Stock Exchange Limited (BSE)
Phiroze Jeejeebhoy Towers
Dalal Street, Mumbai 400 001
532174
&
6321741
National Stock Exchange of India Limited (NSE)
Exchange Plaza, Bandra-Kurla Complex
Bandra (East), Mumbai 400 051 ICICIBANK
New York Stock Exchange (ADSs)2
11, Wall Street, New York, NY 10005, United States of America IBN
1. FII segment of BSE.
2. Each ADS of ICICI Bank represents two underlying equity shares.
The annual fees for fiscal 2011 have been paid to the Bombay Stock Exchange Limited and the National Stock
Exchange Limited, where the shares of the Bank are listed. Also annual listing fees have been paid to NYSE where
ADSs of the Bank are listed.
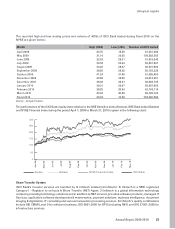
Market Price Information
The reported high and low closing prices and volume of equity shares of ICICI Bank traded during fiscal 2010 on
BSE and NSE are set out in the following table:
Month BSE NSE Total Volume on
BSE and NSE
High (Rs.) Low (Rs.) Volume High (Rs.) Low (Rs.) Volume
April 2009 477.75 349.45 84,911,081 479.20 349.35 321,644,697 406,555,778
May 2009 758.60 520.60 70,405,767 756.15 520.75 285,053,380 355,459,147
June 2009 754.35 689.35 44,228,102 756.15 689.40 198,548,135 242,776,237
July 2009 787.10 628.95 51,971,964 784.75 628.85 214,834,533 266,806,497
August 2009 773.40 704.85 34,211,554 773.75 704.95 136,440,980 170,652,534
September 2009 904.80 736.00 22,562,772 907.60 735.95 106,193,222 128,755,994
October 2009 958.50 771.25 22,843,983 959.10 771.75 121,750,735 144,594,718
November 2009 924.65 787.20 20,726,216 924.50 786.30 103,867,552 124,593,768
December 2009 892.80 808.80 19,905,457 893.55 809.35 93,815,488 113,720,945
January 2010 895.15 788.65 16,984,890 894.85 787.30 92,526,206 109,511,096
February 2010 871.85 798.35 13,205,909 872.15 798.15 74,776,256 87,982,165
March 2010 960.40 897.50 13,748,062 963.65 897.15 85,621,713 99,369,775
Fiscal 2010 960.40 349.45 415,705,757 963.65 349.35 1,835,072,897 2,250,778,654