ICICI Bank 2010 Annual Report Download - page 70
Download and view the complete annual report
Please find page 70 of the 2010 ICICI Bank annual report below. You can navigate through the pages in the report by either clicking on the pages listed below, or by using the keyword search tool below to find specific information within the annual report.-
 1
1 -
2
-
3
-
4
-
5
-
6
-
7
-
8
-
9
-
10
-
11
-
12
-
13
-
14
-
15
-
16
-
17
-
18
-
19
-
20
-
21
-
22
-
23
-
24
-
25
-
26
-
27
-
28
-
29
-
30
-
31
-
32
-
33
-
34
-
35
-
36
-
37
-
38
-
39
-
40
-
41
-
42
-
43
-
44
-
45
-
46
-
47
-
48
-
49
-
50
-
51
-
52
-
53
-
54
-
55
-
56
-
57
-
58
-
59
-
 60
60 -
 61
61 -
 62
62 -
 63
63 -
 64
64 -
 65
65 -
 66
66 -
 67
67 -
 68
68 -
 69
69 -
 70
70 -
 71
71 -
 72
72 -
 73
73 -
 74
74 -
 75
75 -
 76
76 -
 77
77 -
 78
78 -
 79
79 -
 80
80 -
81
-
82
-
83
-
84
-
85
-
86
-
87
-
88
-
89
-
90
-
91
-
92
-
93
-
94
-
95
-
96
-
97
-
98
-
99
-
100
-
101
-
102
-
103
-
104
-
105
-
106
-
107
-
108
-
109
-
110
-
111
-
112
-
113
-
114
-
115
-
116
-
117
-
118
-
119
-
120
-
121
-
122
-
123
-
124
-
125
-
126
-
127
-
128
-
129
-
130
-
131
-
132
-
133
-
134
-
135
-
136
-
137
-
138
-
139
-
140
-
141
-
142
-
143
-
144
-
145
-
146
-
147
-
148
-
149
-
150
-
151
-
152
-
153
-
154
-
155
-
156
-
157
-
158
-
159
-
160
-
161
-
162
-
163
-
164
-
165
-
166
-
167
-
168
-
169
-
170
-
171
-
172
-
173
-
174
-
175
-
176
-
177
-
178
-
179
-
180
-
181
-
182
-
183
-
184
-
185
-
186
-
187
-
188
-
189
-
190
-
191
-
192
-
193
-
194
-
195
-
196
 |
 |

68
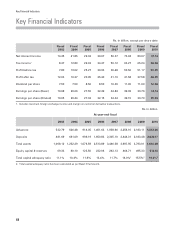
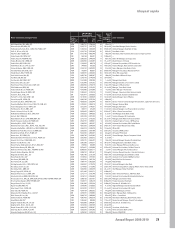
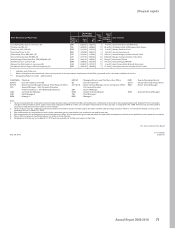
Key Financial Indicators
Rs. in billion, except per share data
Fiscal
2003
Fiscal
2004
Fiscal
2005
Fiscal
2006
Fiscal
2007
Fiscal
2008
Fiscal
2009
Fiscal
2010
Net interest income 14.45 21.85 29.32 39.07 56.37 73.04 83.67 81.14
Fee income18.47 12.89 22.03 34.47 50.12 66.27 65.24 56.50
Profit before tax 7.80 19.02 25.27 30.96 36.48 50.56 51.17 53.45
Profit after tax 12.06 16.37 20.05 25.40 31.10 41.58 37.58 40.25
Dividend per share 7.50 7.50 8.50 8.50 10.00 11.00 11.00 12.00
Earnings per share (Basic) 19.68 26.66 27.55 32.49 34.84 39.39 33.76 36.14
Earnings per share (Diluted) 19.65 26.44 27.33 32.15 34.64 39.15 33.70 35.99
1. Includes merchant foreign exchange income and margin on customer derivative transactions.
Rs. in billion
At year-end fiscal
2003 2004 2005 2006 2007 2008 2009 2010
Advances 532.79 626.48 914.05 1,461.63 1,958.66 2,256.16 2,183.11 1,812.06
Deposits 481.69 681.09 998.19 1,650.83 2,305.10 2,444.31 2,183.48 2,020.17
Total assets 1,068.12 1,252.29 1,676.59 2,513.89 3,446.58 3,997.95 3,793.01 3,634.00
Equity capital & reserves 69.33 80.10 125.50 222.06 243.13 464.71 495.33 516.18
Total capital adequacy ratio 11.1% 10.4% 11.8% 13.4% 11.7% 14.0%215.5%219.4%2
2. Total capital adequacy ratio has been calculated as per Basel ll framework.
Key Financial Indicators