ICICI Bank 2010 Annual Report Download - page 157
Download and view the complete annual report
Please find page 157 of the 2010 ICICI Bank annual report below. You can navigate through the pages in the report by either clicking on the pages listed below, or by using the keyword search tool below to find specific information within the annual report.-
 1
1 -
2
-
3
-
4
-
5
-
6
-
7
-
8
-
9
-
10
-
11
-
12
-
13
-
14
-
15
-
16
-
17
-
18
-
19
-
20
-
21
-
22
-
23
-
24
-
25
-
26
-
27
-
28
-
29
-
30
-
31
-
32
-
33
-
34
-
35
-
36
-
37
-
38
-
39
-
40
-
41
-
42
-
43
-
44
-
45
-
46
-
47
-
48
-
49
-
50
-
51
-
52
-
53
-
54
-
55
-
56
-
57
-
58
-
59
-
60
-
61
-
62
-
63
-
64
-
65
-
66
-
67
-
68
-
69
-
70
-
71
-
72
-
73
-
74
-
75
-
76
-
77
-
78
-
79
-
80
-
81
-
82
-
83
-
84
-
85
-
86
-
87
-
88
-
89
-
90
-
91
-
92
-
93
-
94
-
95
-
96
-
97
-
98
-
99
-
100
-
101
-
102
-
103
-
104
-
105
-
106
-
107
-
108
-
109
-
110
-
111
-
112
-
113
-
114
-
115
-
116
-
117
-
118
-
119
-
120
-
121
-
122
-
123
-
124
-
125
-
126
-
127
-
128
-
129
-
130
-
131
-
132
-
133
-
134
-
135
-
136
-
137
-
138
-
139
-
140
-
141
-
142
-
143
-
144
-
145
-
146
-
 147
147 -
 148
148 -
 149
149 -
 150
150 -
 151
151 -
 152
152 -
 153
153 -
 154
154 -
 155
155 -
 156
156 -
 157
157 -
 158
158 -
 159
159 -
 160
160 -
 161
161 -
 162
162 -
 163
163 -
 164
164 -
 165
165 -
 166
166 -
 167
167 -
168
-
169
-
170
-
171
-
172
-
173
-
174
-
175
-
176
-
177
-
178
-
179
-
180
-
181
-
182
-
183
-
184
-
185
-
186
-
187
-
188
-
189
-
190
-
191
-
192
-
193
-
194
-
195
-
196
 |
 |

F77
schedules
forming part of the Consolidated Accounts (Contd.)
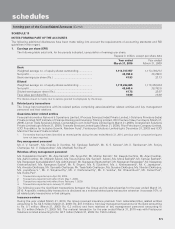
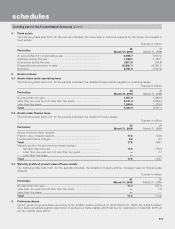
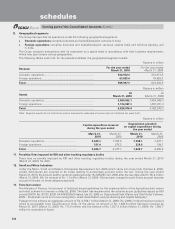
4. Fixed assets
The following table sets forth, for the periods indicated, the movement in software acquired by the Group, as included in
fixed assets.
Rupees in million
Particulars At
March 31, 2010 At
March 31, 2009
At cost at March 31 of preceding year ................................................... 6,906.7 5,631.8
Additions during the year ........................................................................ 1,369.5 1,329.7
Deductions during the year..................................................................... (261.6) (54.8)
Depreciation/amortisation to date .......................................................... (5,250.7) (4,385.1)
Net block ................................................................................................. 2,763.9 2,521.6
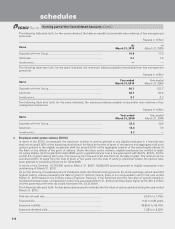
5. Assets on lease
5.1 Assets taken under operating lease
The following table sets forth, for the periods indicated, the details of future rentals payable on operating leases.
Rupees in million
Particulars At
March 31, 2010 At
March 31, 2009
Not later than one year ........................................................................... 1,651.9 1,896.0
Later than one year and not later than five years ................................... 4,211.4 4,904.4
Later than five years ................................................................................ 1,500.6 1,730.9
Total ........................................................................................................ 7,363.9 8,531.3
5.2 Assets under finance lease
The following table sets forth, for the periods indicated, the details of finance leases.
Rupees in million
Particulars At
March 31, 2010 At
March 31, 2009
Future minimum lease receipts
Present value of lease receipts ............................................................... 17.4 174.8
Unmatured finance charges.................................................................... 0.2 9.3
Total ........................................................................................................ 17.6 184.1
Maturity profile of future minimum lease receipts
– Not later than one year ................................................................... 17.6 176.4
– Later than one year and not later than five years ........................... —7.7
– Later than five years ........................................................................ ——
Total ........................................................................................................ 17.6 184.1
5.3 Maturity profile of present value of lease rentals
The following table sets forth, for the periods indicated, the details of maturity profile of present value of finance lease
receipts.
Rupees in million
Particulars At
March 31, 2010 At
March 31, 2009
Not later than one year ........................................................................... 17.4 167.3
Later than one year and not later than five years ................................... —7.5
Later than five years ................................................................................ ——
Total ........................................................................................................ 17.4 174.8
6. Preference shares
Certain government securities amounting to Rs. 2,405.2 million at March 31, 2010 (March 31, 2009: Rs. 2,356.6 million)
have been earmarked against redemption of preference share capital, which fall due for redemption on April 20, 2018, as
per the original issue terms.