ICICI Bank 2010 Annual Report Download - page 125
Download and view the complete annual report
Please find page 125 of the 2010 ICICI Bank annual report below. You can navigate through the pages in the report by either clicking on the pages listed below, or by using the keyword search tool below to find specific information within the annual report.-
 1
1 -
2
-
3
-
4
-
5
-
6
-
7
-
8
-
9
-
10
-
11
-
12
-
13
-
14
-
15
-
16
-
17
-
18
-
19
-
20
-
21
-
22
-
23
-
24
-
25
-
26
-
27
-
28
-
29
-
30
-
31
-
32
-
33
-
34
-
35
-
36
-
37
-
38
-
39
-
40
-
41
-
42
-
43
-
44
-
45
-
46
-
47
-
48
-
49
-
50
-
51
-
52
-
53
-
54
-
55
-
56
-
57
-
58
-
59
-
60
-
61
-
62
-
63
-
64
-
65
-
66
-
67
-
68
-
69
-
70
-
71
-
72
-
73
-
74
-
75
-
76
-
77
-
78
-
79
-
80
-
81
-
82
-
83
-
84
-
85
-
86
-
87
-
88
-
89
-
90
-
91
-
92
-
93
-
94
-
95
-
96
-
97
-
98
-
99
-
100
-
101
-
102
-
103
-
104
-
105
-
106
-
107
-
108
-
109
-
110
-
111
-
112
-
113
-
114
-
 115
115 -
 116
116 -
 117
117 -
 118
118 -
 119
119 -
 120
120 -
 121
121 -
 122
122 -
 123
123 -
 124
124 -
 125
125 -
 126
126 -
 127
127 -
 128
128 -
 129
129 -
 130
130 -
 131
131 -
 132
132 -
 133
133 -
 134
134 -
 135
135 -
136
-
137
-
138
-
139
-
140
-
141
-
142
-
143
-
144
-
145
-
146
-
147
-
148
-
149
-
150
-
151
-
152
-
153
-
154
-
155
-
156
-
157
-
158
-
159
-
160
-
161
-
162
-
163
-
164
-
165
-
166
-
167
-
168
-
169
-
170
-
171
-
172
-
173
-
174
-
175
-
176
-
177
-
178
-
179
-
180
-
181
-
182
-
183
-
184
-
185
-
186
-
187
-
188
-
189
-
190
-
191
-
192
-
193
-
194
-
195
-
196
 |
 |

F45
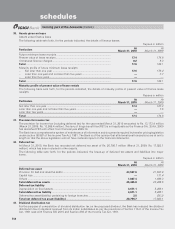
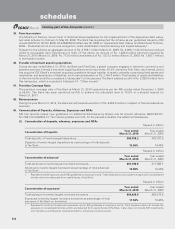
Rupees in million
Concentration of NPAs Year ended
March 31, 2010 Year ended
March 31, 2009
Total exposure1 to top four NPA accounts ................................................... 7,200.3 4,770.9
1. Represents gross exposure (funded and non-funded).
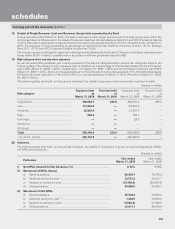
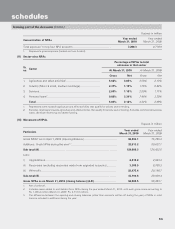
(II) Sector-wise NPAs
Sr.
no. Sector
Percentage of NPAs to total
advances in that sector
At March 31, 2010 At March 31, 2009
Gross Net Gross Net
1. Agriculture and allied activities1 ............................................. 5.62% 3.05% 3.58% 2.13%
2. Industry (Micro & small, medium and large) .......................... 2.37% 1.19% 1.75% 0.92%
3. Services .................................................................................. 2.60% 1.16% 2.50% 1.71%
4. Personal loans2 ....................................................................... 9.02% 3.34% 7.46% 3.20%
Total ....................................................................................... 5.06% 2.12% 4.32% 2.09%
1. Represents loans towards agriculture and allied activities that qualify for priority sector lending.
2. Excludes retail loans towards agriculture and allied activities that qualify for priority sector lending. Excludes commercial business
loans, developer financing and dealer funding.
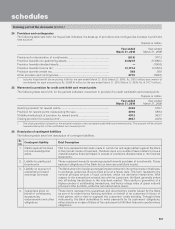
(III) Movement of NPAs
Rupees in million
Particulars Year ended
March 31, 2010 Year ended
March 31, 2009
Gross NPAs1 as on April 1, 2009 (Opening Balance) ............................................ 96,493.1 75,795.4
Additions: Fresh NPAs during the year2, 3 ............................................................. 32,513.2 50,637.1
Sub total (A) ......................................................................................................... 129,006.3 126,432.5
Less:
i) Upgradations ................................................................................................. 2,415.9 2,963.4
iii) Recoveries (excluding recoveries made from upgraded accounts) ............ 3,308.5 6,785.3
iii) Write-offs ..................................................................................................... 28,475.4 20,190.7
Sub-total (B) ........................................................................................................ 34,199.8 29,939.4
Gross NPAs as on March 31, 2010 (closing balance) (A-B) ............................. 94,806.5 96,493.1
1. Net of write-off.
2. Includes cases added to and deleted from NPAs during the year ended March 31, 2010, with such gross loans amounting to
Rs. 1,060.2 million (March 31, 2009: Rs. 4,713.0 million).
3. The difference between the opening and closing balances (other than accounts written off during the year) of NPAs in retail
loans is included in additions during the year.
schedules
forming part of the Accounts (Contd.)