ICICI Bank 2010 Annual Report Download - page 55
Download and view the complete annual report
Please find page 55 of the 2010 ICICI Bank annual report below. You can navigate through the pages in the report by either clicking on the pages listed below, or by using the keyword search tool below to find specific information within the annual report.-
 1
1 -
2
-
3
-
4
-
5
-
6
-
7
-
8
-
9
-
10
-
11
-
12
-
13
-
14
-
15
-
16
-
17
-
18
-
19
-
20
-
21
-
22
-
23
-
24
-
25
-
26
-
27
-
28
-
29
-
30
-
31
-
32
-
33
-
34
-
35
-
36
-
37
-
38
-
39
-
40
-
41
-
42
-
43
-
44
-
 45
45 -
 46
46 -
 47
47 -
 48
48 -
 49
49 -
 50
50 -
 51
51 -
 52
52 -
 53
53 -
 54
54 -
 55
55 -
 56
56 -
 57
57 -
 58
58 -
 59
59 -
 60
60 -
 61
61 -
 62
62 -
 63
63 -
 64
64 -
 65
65 -
66
-
67
-
68
-
69
-
70
-
71
-
72
-
73
-
74
-
75
-
76
-
77
-
78
-
79
-
80
-
81
-
82
-
83
-
84
-
85
-
86
-
87
-
88
-
89
-
90
-
91
-
92
-
93
-
94
-
95
-
96
-
97
-
98
-
99
-
100
-
101
-
102
-
103
-
104
-
105
-
106
-
107
-
108
-
109
-
110
-
111
-
112
-
113
-
114
-
115
-
116
-
117
-
118
-
119
-
120
-
121
-
122
-
123
-
124
-
125
-
126
-
127
-
128
-
129
-
130
-
131
-
132
-
133
-
134
-
135
-
136
-
137
-
138
-
139
-
140
-
141
-
142
-
143
-
144
-
145
-
146
-
147
-
148
-
149
-
150
-
151
-
152
-
153
-
154
-
155
-
156
-
157
-
158
-
159
-
160
-
161
-
162
-
163
-
164
-
165
-
166
-
167
-
168
-
169
-
170
-
171
-
172
-
173
-
174
-
175
-
176
-
177
-
178
-
179
-
180
-
181
-
182
-
183
-
184
-
185
-
186
-
187
-
188
-
189
-
190
-
191
-
192
-
193
-
194
-
195
-
196
 |
 |
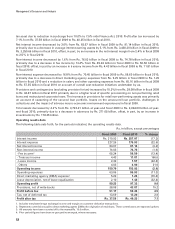
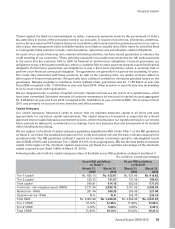
Key ratios
The following table sets forth, for the periods indicated, the key financial ratios.
Fiscal 2009 Fiscal 2010
Return on average equity (%)17.7 7.9
Return on average assets (%)21.0 1.1
Earnings per share (Rs.) 33.8 36.1
Book value per share (Rs.) 444.9 463.0
Fee to income (%) 41.4 36.6
Cost to income (%)343.4 37.0
1. Return on average equity is the ratio of the net profit after tax to the quarterly average equity and reserves.
2. Return on average assets is the ratio of net profit after tax to average assets. The average balances are the averages of daily
balances, except averages of foreign branches which are calculated on monthly basis.
3. Cost represents operating expense including DMA cost which is expensed upfront but excluding lease depreciation. Income
represents net interest income and non-interest income and is net of lease depreciation.
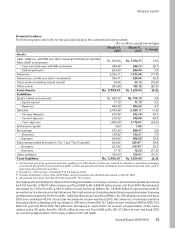
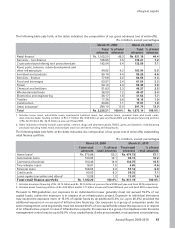
Net interest income and spread analysis
The following table sets forth, for the periods indicated, the net interest income and spread analysis.
Rs. in billion, except percentages
Fiscal 2009 Fiscal 2010 % change
Average interest-earning assets1Rs. 3,436.20 Rs. 3,259.66 (5.1)
Average interest-bearing liabilities1 3,249.16 3,054.87 (6.0)
Net interest margin 2.4% 2.5% —
Average yield 9.1% 7.9% —
Average cost of funds 7.0% 5.8% —
Interest spread 2.1% 2.1% —
1. The average balances are the averages of daily balances, except averages of foreign branches which are calculated on monthly basis.
2. All amounts have been rounded off to the nearest Rs. 10.0 million.
Net interest income
Net interest income decreased by 3.0% from Rs. 83.67 billion in fiscal 2009 to Rs. 81.14 billion in fiscal 2010
primarily due to a decrease of Rs. 176.54 billion or 5.1% in the average volume of interest-earning assets, offset,
in part, by an increase in the net interest margin from 2.4% in fiscal 2009 to 2.5% in fiscal 2010.
Interest income decreased by 17.3% from Rs. 310.93 billion in fiscal 2009 to Rs. 257.07 billion in fiscal 2010, due
to a decrease in average interest-earning assets by 5.1% i.e., Rs. 176.54 billion and a 116 basis points decrease
in the yield on average interest-earning assets.
Average interest-earning assets decreased by Rs. 176.54 billion or 5.1% from Rs. 3,436.20 billion in fiscal 2009
to Rs. 3,259.66 billion in fiscal 2010. The decrease in average interest-earning assets was primarily due to the
decrease in average advances by Rs. 277.41 billion. Average advances decreased primarily due to a decrease in
retail advances. Net retail advances (including dealer financing and developer financing portfolios) declined by
25.6% from Rs. 1,062.03 billion at year-end fiscal 2009 to Rs. 790.45 billion at year-end fiscal 2010. Net advances
of overseas branches (including offshore banking unit) decreased by USD 0.7 billion or 6.5% from USD 10.7
billion at year-end fiscal 2009 to USD 10.0 billion at year-end fiscal 2010. In rupee terms, net advances of overseas
branches decreased by 16.9%from Rs. 542.91 billion at year-end fiscal 2009 to Rs. 451.37 billion at year-end fiscal
2010 due to rupee appreciation. Average earning investments increased by 7.7% from Rs. 971.00 billion in fiscal
2009 to Rs. 1,046.05 billion in fiscal 2010 primarily due to an increase in non-SLR earning investments, mainly
investments in mutual funds. During fiscal 2010, average SLR investments decreased by Rs. 24.06 billion primarily
on account of reduction in domestic net demand and time liabilities, offset, in part, by a 100 basis points increase
in SLR requirement from 24.0% to 25.0% during fiscal 2010.
53
Annual Report 2009-2010
khayaal aapka