ICICI Bank 2010 Annual Report Download - page 174
Download and view the complete annual report
Please find page 174 of the 2010 ICICI Bank annual report below. You can navigate through the pages in the report by either clicking on the pages listed below, or by using the keyword search tool below to find specific information within the annual report.-
 1
1 -
2
-
3
-
4
-
5
-
6
-
7
-
8
-
9
-
10
-
11
-
12
-
13
-
14
-
15
-
16
-
17
-
18
-
19
-
20
-
21
-
22
-
23
-
24
-
25
-
26
-
27
-
28
-
29
-
30
-
31
-
32
-
33
-
34
-
35
-
36
-
37
-
38
-
39
-
40
-
41
-
42
-
43
-
44
-
45
-
46
-
47
-
48
-
49
-
50
-
51
-
52
-
53
-
54
-
55
-
56
-
57
-
58
-
59
-
60
-
61
-
62
-
63
-
64
-
65
-
66
-
67
-
68
-
69
-
70
-
71
-
72
-
73
-
74
-
75
-
76
-
77
-
78
-
79
-
80
-
81
-
82
-
83
-
84
-
85
-
86
-
87
-
88
-
89
-
90
-
91
-
92
-
93
-
94
-
95
-
96
-
97
-
98
-
99
-
100
-
101
-
102
-
103
-
104
-
105
-
106
-
107
-
108
-
109
-
110
-
111
-
112
-
113
-
114
-
115
-
116
-
117
-
118
-
119
-
120
-
121
-
122
-
123
-
124
-
125
-
126
-
127
-
128
-
129
-
130
-
131
-
132
-
133
-
134
-
135
-
136
-
137
-
138
-
139
-
140
-
141
-
142
-
143
-
144
-
145
-
146
-
147
-
148
-
149
-
150
-
151
-
152
-
153
-
154
-
155
-
156
-
157
-
158
-
159
-
160
-
161
-
162
-
163
-
 164
164 -
 165
165 -
 166
166 -
 167
167 -
 168
168 -
 169
169 -
 170
170 -
 171
171 -
 172
172 -
 173
173 -
 174
174 -
 175
175 -
 176
176 -
 177
177 -
 178
178 -
 179
179 -
 180
180 -
 181
181 -
 182
182 -
 183
183 -
 184
184 -
185
-
186
-
187
-
188
-
189
-
190
-
191
-
192
-
193
-
194
-
195
-
196
 |
 |

F94
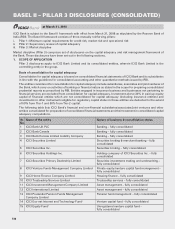
BASEL II – PILLAR 3 DISCLOSURES (CONSOLIDATED)
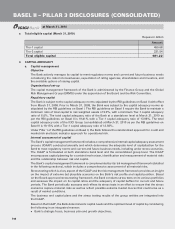
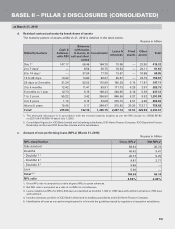
Capital ratios Consolidated1ICICI Bank
Ltd.1
ICICI Bank
UK PLC2
ICICI Bank
Canada2
ICICI Bank
Eurasia LLC2,3
Tier-1 capital ratio 12.92% 13.96% 11.70% 22.19% n.a.
Total capital ratio 19.15% 19.41% 17.30% 23.40% 26.63%
1. Computed as per RBI guidelines on Basel II.
2. Computed as per capital adequacy framework guidelines issued by regulators of respective jurisdictions.
3. Total capital ratio is required to be reported in line with regulatory norms stipulated by Central Bank of Russia.
4. RISK MANAGEMENT FRAMEWORK
As a financial intermediary, the Bank is exposed to various types of risks including credit, market, liquidity,
operational, legal, compliance and reputation risks. The objective of the risk management framework at the Bank
is to ensure that various risks are understood, measured and monitored and that the policies and procedures
established to address these risks are strictly adhered to.
The key principles underlying the risk management framework at the Bank are as follows:
1. The Board of Directors has oversight on all the risks assumed by the Bank. Specific Committees of the Board
have been constituted to facilitate focused oversight of various risks. Risk Committee reviews policies in
relation to various risks including liquidity, interest rate, investment policies and strategy, and regulatory
and compliance issues in relation thereto. Credit Committee reviews developments in key industrial sectors
and the Bank’s exposure to these sectors and various portfolios on a periodic basis. Audit Committee
provides direction to and also monitors the quality of the internal audit function. Asset Liability Management
Committee (ALCO) is responsible for managing the balance sheet and reviewing the Bank’s asset-liability
position.
2. Policies approved from time to time by the Board of Directors/Committees of the Board form the governing
framework for each type of risk. The business activities are undertaken within this policy framework.
3. Independent groups and sub-groups have been constituted across the Bank to facilitate independent evaluation,
monitoring and reporting of various risks. These control groups function independently of the business groups/
sub-groups.
The risk management framework forms the basis of developing consistent risk principles across the Bank, overseas
branches and overseas banking subsidiaries.
Material risks are identified, measured, monitored and reported to the Board of Directors and Board level committees
through the following:
a. Key risk indicators
Key risk indicators are presented to the Risk Committee on a periodic basis. The presentation covers an
overview of the key developments in the global and domestic economy as well as trends observed in the major
industries where the Bank has an exposure. Additionally, risk indicators with respect to credit risk, liquidity
risk and market risk are also presented and discussed.
b. ICAAP/stress testing
As part of ICAAP, the Bank has conducted stress testing under various historical and hypothetical scenarios
to assess the impact of stress on its capital position. The methodology for the stress testing is approved by
the Board of Directors. The results of stress testing are reported to the Board of Directors and submitted to
RBI annually as part of the ICAAP. As detailed in the ICAAP, stress test results are reported periodically for
various risks to the ALCO.
c. Stress tolerance limits
In In line with stress testing results, risk tolerance limits have been formulated for various risks. The actual
position against the limits is being periodically reported to various Committees of the Board.
d. Risk profile template
Bank-wide risk dashboard covering various risks of the Bank is presented to the Risk Committee and to the
Board on a quarterly basis. The risk dashboard provides the level and the direction of risk at Bank level with
a comparison to the previous quarter. The level and direction of risk are arrived at based on pre-determined
parameters.
at March 31, 2010