ICICI Bank 2010 Annual Report Download - page 29
Download and view the complete annual report
Please find page 29 of the 2010 ICICI Bank annual report below. You can navigate through the pages in the report by either clicking on the pages listed below, or by using the keyword search tool below to find specific information within the annual report.-
 1
1 -
2
-
3
-
4
-
5
-
6
-
7
-
8
-
9
-
10
-
11
-
12
-
13
-
14
-
15
-
16
-
17
-
18
-
 19
19 -
 20
20 -
 21
21 -
 22
22 -
 23
23 -
 24
24 -
 25
25 -
 26
26 -
 27
27 -
 28
28 -
 29
29 -
 30
30 -
 31
31 -
 32
32 -
 33
33 -
 34
34 -
 35
35 -
 36
36 -
 37
37 -
 38
38 -
 39
39 -
40
-
41
-
42
-
43
-
44
-
45
-
46
-
47
-
48
-
49
-
50
-
51
-
52
-
53
-
54
-
55
-
56
-
57
-
58
-
59
-
60
-
61
-
62
-
63
-
64
-
65
-
66
-
67
-
68
-
69
-
70
-
71
-
72
-
73
-
74
-
75
-
76
-
77
-
78
-
79
-
80
-
81
-
82
-
83
-
84
-
85
-
86
-
87
-
88
-
89
-
90
-
91
-
92
-
93
-
94
-
95
-
96
-
97
-
98
-
99
-
100
-
101
-
102
-
103
-
104
-
105
-
106
-
107
-
108
-
109
-
110
-
111
-
112
-
113
-
114
-
115
-
116
-
117
-
118
-
119
-
120
-
121
-
122
-
123
-
124
-
125
-
126
-
127
-
128
-
129
-
130
-
131
-
132
-
133
-
134
-
135
-
136
-
137
-
138
-
139
-
140
-
141
-
142
-
143
-
144
-
145
-
146
-
147
-
148
-
149
-
150
-
151
-
152
-
153
-
154
-
155
-
156
-
157
-
158
-
159
-
160
-
161
-
162
-
163
-
164
-
165
-
166
-
167
-
168
-
169
-
170
-
171
-
172
-
173
-
174
-
175
-
176
-
177
-
178
-
179
-
180
-
181
-
182
-
183
-
184
-
185
-
186
-
187
-
188
-
189
-
190
-
191
-
192
-
193
-
194
-
195
-
196
 |
 |

27Annual Report 2009-2010
khayaal aapka
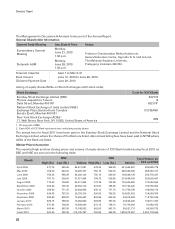
The reported high and low closing prices and volume of ADSs of ICICI Bank traded during fiscal 2010 on the
NYSE are given below:
Month High (US$) Low (US$) Number of ADS traded
April 2009 20.75 14.36 81,201,280
May 2009 31.14 20.55 109,282,052
June 2009 32.62 28.01 61,518,543
July 2009 33.32 26.04 69,301,567
August 2009 33.20 28.67 40,301,806
September 2009 38.56 29.35 56,152,335
October 2009 41.24 31.45 61,055,450
November 2009 40.68 32.80 52,614,351
December 2009 38.39 34.21 38,003,705
January 2010 39.31 33.47 56,907,655
February 2010 38.25 33.54 42,163,116
March 2010 43.43 38.89 55,128,726
Fiscal 2010 43.43 14.36 723,630,586
Source : Google Finance
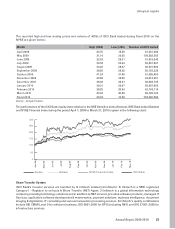
The performance of the ICICI Bank equity share relative to the BSE Sensitive Index (Sensex), BSE Bank Index (Bankex)
and NYSE Financial Index during the period April 1, 2009 to March 31, 2010 is given in the following chart:
Share Transfer System
ICICI Bank’s investor services are handled by 3i Infotech Limited (3i Infotech). 3i Infotech is a SEBI registered
Category I – Registrar to an Issue & Share Transfer (R&T) Agent. 3i Infotech is a global information technology
company providing technology solutions and in addition to R&T services provides software products, managed IT
Services, application software development & maintenance, payment solutions, business intelligence, document
imaging & digitization, IT consulting and various transaction processing services. 3i Infotech’s quality certifications
include SEI CMMI Level 5 for software business, ISO 9001:2000 for BPO (including R&T) and ISO 27001:2005 for
infrastructure services.
Apr-09
May-09
Jun-09
Jul-09
Aug-09
Sep-09
Oct-09
Nov-09
Dec-09
Jan-10
Feb-10
Mar-10
Sensex Bankex NYSE Financial Index ICICI Bank
0
50
100
150
200
250
300