ICICI Bank 2010 Annual Report Download - page 155
Download and view the complete annual report
Please find page 155 of the 2010 ICICI Bank annual report below. You can navigate through the pages in the report by either clicking on the pages listed below, or by using the keyword search tool below to find specific information within the annual report.-
 1
1 -
2
-
3
-
4
-
5
-
6
-
7
-
8
-
9
-
10
-
11
-
12
-
13
-
14
-
15
-
16
-
17
-
18
-
19
-
20
-
21
-
22
-
23
-
24
-
25
-
26
-
27
-
28
-
29
-
30
-
31
-
32
-
33
-
34
-
35
-
36
-
37
-
38
-
39
-
40
-
41
-
42
-
43
-
44
-
45
-
46
-
47
-
48
-
49
-
50
-
51
-
52
-
53
-
54
-
55
-
56
-
57
-
58
-
59
-
60
-
61
-
62
-
63
-
64
-
65
-
66
-
67
-
68
-
69
-
70
-
71
-
72
-
73
-
74
-
75
-
76
-
77
-
78
-
79
-
80
-
81
-
82
-
83
-
84
-
85
-
86
-
87
-
88
-
89
-
90
-
91
-
92
-
93
-
94
-
95
-
96
-
97
-
98
-
99
-
100
-
101
-
102
-
103
-
104
-
105
-
106
-
107
-
108
-
109
-
110
-
111
-
112
-
113
-
114
-
115
-
116
-
117
-
118
-
119
-
120
-
121
-
122
-
123
-
124
-
125
-
126
-
127
-
128
-
129
-
130
-
131
-
132
-
133
-
134
-
135
-
136
-
137
-
138
-
139
-
140
-
141
-
142
-
143
-
144
-
 145
145 -
 146
146 -
 147
147 -
 148
148 -
 149
149 -
 150
150 -
 151
151 -
 152
152 -
 153
153 -
 154
154 -
 155
155 -
 156
156 -
 157
157 -
 158
158 -
 159
159 -
 160
160 -
 161
161 -
 162
162 -
 163
163 -
 164
164 -
 165
165 -
166
-
167
-
168
-
169
-
170
-
171
-
172
-
173
-
174
-
175
-
176
-
177
-
178
-
179
-
180
-
181
-
182
-
183
-
184
-
185
-
186
-
187
-
188
-
189
-
190
-
191
-
192
-
193
-
194
-
195
-
196
 |
 |

F75
schedules
forming part of the Consolidated Accounts (Contd.)
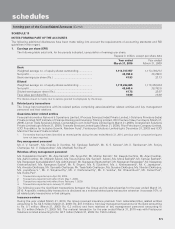
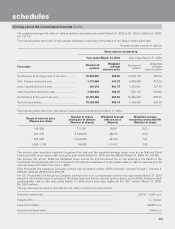
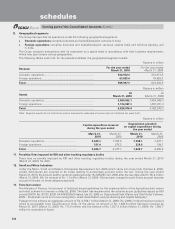
The weighted average fair value of options granted during the year ended March 31, 2010 is Rs. 199.91 (March 31, 2009:
Rs. 331.19)
The following table sets forth, for the periods indicated, a summary of the status of the Bank’s stock option plan.
Rupees, except number of options
Stock options outstanding
Year ended March 31, 2010 Year ended March 31, 2009
Particulars Number of
options
Weighted
average
exercise price
Number of
options
Weighted
average
exercise price
Outstanding at the beginning of the year .............. 18,992,504 685.05 15,638,152 596.32
Add: Granted during the year ................................ 1,731,000 434.78 5,640,500 912.30
Less: Lapsed during the year ................................ 365,372 661.78 1,723,001 737.40
Less: Exercised during the year ........................... 1,594,672 366.38 563,147 336.96
Outstanding at the end of the year ........................ 18,763,460 689.50 18,992,504 685.05
Options exercisable ............................................... 10,104,780 609.18 7,188,420 496.10
The following table sets forth, summary of stock options outstanding at March 31, 2010.
Range of exercise price
(Rupees per share)
Number of shares
arising out of options
(Number of shares)
Weighted average
exercise price
(Rupees)
Weighted average
remaining contractual life
(Number of years)
105–299 117,601 146.21 2.03
300–599 9,339,639 462.04 6.08
600–999 9,238,220 923.24 7.61
1,000–1,399 68,000 1,114.57 7.65
The options were exercised regularly throughout the year and the weighted average share price as per National Stock
Exchange (NSE) price volume data during the year ended March 31, 2010 was Rs. 853.80 (March 31, 2009: Rs. 723.55).
The Finance (No. 2) Act, 2009 has abolished fringe benefit tax and introduced tax on the scheme in the hands of the
employees as perquisites which is computed on the difference between the fair market value on date of exercise and the
exercise price with effect from April 1, 2009.
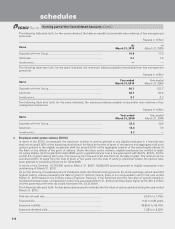
ICICI Prudential Life Insurance Company Limited has formulated various ESOS schemes, namely Founder I, Founder II,
2004-05, 2005-06, 2006-07 and 2007-08.
For ICICI Prudential Life Insurance Company Limited there is no compensation cost for the year ended March 31, 2010
based on the intrinsic value of options. If the entity had used the fair value of options based on the Black-Scholes model,
compensation cost for the year ended March 31, 2010 would have been higher by Rs. 175.1 million (March 31, 2009:
Rs. 359.0 million).
The key assumptions used to estimate the fair value of options are given below.
Risk-free interest rate ............................................................................................... 6.87% – 8.00% p.a.
Expected life ............................................................................................................ 3 – 5 years
Expected volatility .................................................................................................... 28.65% p.a.
Expected dividend yield ........................................................................................... 1.50% p.a.