ICICI Bank 2010 Annual Report Download - page 37
Download and view the complete annual report
Please find page 37 of the 2010 ICICI Bank annual report below. You can navigate through the pages in the report by either clicking on the pages listed below, or by using the keyword search tool below to find specific information within the annual report.-
 1
1 -
2
-
3
-
4
-
5
-
6
-
7
-
8
-
9
-
10
-
11
-
12
-
13
-
14
-
15
-
16
-
17
-
18
-
19
-
20
-
21
-
22
-
23
-
24
-
25
-
26
-
 27
27 -
 28
28 -
 29
29 -
 30
30 -
 31
31 -
 32
32 -
 33
33 -
 34
34 -
 35
35 -
 36
36 -
 37
37 -
 38
38 -
 39
39 -
 40
40 -
 41
41 -
 42
42 -
 43
43 -
 44
44 -
 45
45 -
 46
46 -
 47
47 -
48
-
49
-
50
-
51
-
52
-
53
-
54
-
55
-
56
-
57
-
58
-
59
-
60
-
61
-
62
-
63
-
64
-
65
-
66
-
67
-
68
-
69
-
70
-
71
-
72
-
73
-
74
-
75
-
76
-
77
-
78
-
79
-
80
-
81
-
82
-
83
-
84
-
85
-
86
-
87
-
88
-
89
-
90
-
91
-
92
-
93
-
94
-
95
-
96
-
97
-
98
-
99
-
100
-
101
-
102
-
103
-
104
-
105
-
106
-
107
-
108
-
109
-
110
-
111
-
112
-
113
-
114
-
115
-
116
-
117
-
118
-
119
-
120
-
121
-
122
-
123
-
124
-
125
-
126
-
127
-
128
-
129
-
130
-
131
-
132
-
133
-
134
-
135
-
136
-
137
-
138
-
139
-
140
-
141
-
142
-
143
-
144
-
145
-
146
-
147
-
148
-
149
-
150
-
151
-
152
-
153
-
154
-
155
-
156
-
157
-
158
-
159
-
160
-
161
-
162
-
163
-
164
-
165
-
166
-
167
-
168
-
169
-
170
-
171
-
172
-
173
-
174
-
175
-
176
-
177
-
178
-
179
-
180
-
181
-
182
-
183
-
184
-
185
-
186
-
187
-
188
-
189
-
190
-
191
-
192
-
193
-
194
-
195
-
196
 |
 |

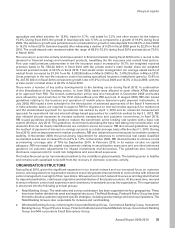
agriculture and allied activities for 12.8%, trade for 5.7%, real estate for 3.2% and other sectors for the balance
15.0%. During fiscal 2010, the growth in total deposits was 17.0% as compared to a growth of 19.9% during fiscal
2009. The decline in growth was primarily due to a moderation in growth in time deposits from 23.9% in fiscal 2009
to 16.2% in fiscal 2010. Demand deposits after witnessing a decline of 0.2% in fiscal 2009 grew by 22.2% in fiscal
2010. The credit-deposit ratio remained within the range of 68.0%-72.0% during fiscal 2010 and was about 72.0%
in March 2010.
The recovery in economic activity and improvement in financial markets during fiscal 2010 led to a revival in the
demand for financial savings and investment products, benefiting the life insurance and mutual fund sectors.
First year retail premium underwritten in the life insurance sector increased by 16.7% (on weighted received
premium basis) to Rs. 550.24 billion in fiscal 2010 with the private sector’s retail market share (on weighted
received premium basis) at 52.3% in fiscal 2010. Total assets under management (on average assets basis) of
mutual funds increased by 51.5% from Rs. 4,932.85 billion in March 2009 to Rs. 7,475.25 billion in March 2010.
Gross premium in the non-life insurance sector (excluding specialised insurance institutions) grew by 13.4% to
Rs. 347.55 billion in fiscal 2010 compared to growth rates of 9.2% in fiscal 2009 and 12.3% in fiscal 2008, with the
private sector’s market share at 40.9% in fiscal 2010.
There were a number of key policy developments in the banking sector during fiscal 2010. In continuation
of the liberalisation of the banking sector, in June 2009, banks were allowed to open offsite ATMs without
prior approval from RBI. The branch authorisation policy was also liberalised in December 2009 and banks
were allowed to open branches in Tier III-VI cities without prior RBI approval. In August 2009, RBI also issued
guidelines relating to the issuance and operation of mobile phone based pre-paid payment instruments. In
July 2009, RBI issued a time schedule for the introduction of advanced approaches of the Basel II framework
in India whereby banks are required to apply to RBI for migration to internal models approach for market risk
and the standardised approach for operational risk earliest by April 1, 2010 and for advanced measurement
approach for operational risk and internal ratings based approaches for credit risk earliest by April 1, 2012. RBI
also initiated several measures to increase systemic transparency and customer convenience. In April 2010,
RBI issued guidelines directing banks to replace the benchmark prime lending rate system with a base rate
system effective July 2010. The guidelines recommend calculating the base rate taking into consideration cost
elements that can be clearly identified and are common across borrowers. RBI also issued guidelines revising
the method of payment of interest on savings accounts to a daily average basis effective April 1, 2010. During
fiscal 2010, with an improvement in market conditions, RBI also initiated several measures to maintain systemic
stability. In November 2009, the provisioning requirement for advances to commercial real estate classified
as standard assets was increased from 0.4% to 1.0%. In December 2009, RBI directed banks to achieve a total
provisioning coverage ratio of 70% by September 2010. In February 2010, in its master circular on capital
adequacy, RBI increased the capital requirements relating to securitisation exposures and provided enhanced
guidance on valuation adjustments for illiquid investments and derivatives. The guidelines also increased
disclosure requirements for credit risk mitigations and securitised exposures.
The Indian financial sector has remained resilient to the volatility in global markets. The banking sector is healthy
and remains well capitalised to benefit from the recovery in domestic economic activity.
ORGANISATION STRUCTURE
During fiscal 2010, given the significant expansion in our branch network and our increased focus on customer
service, we reorganised our organisation structure to provide greater empowerment to our branches with enhanced
senior management oversight of their operations. We expect our branch network to serve as an integrated channel
for deposit mobilisation, retail asset origination and distribution of third party products. At the same time, we seek
to ensure effective control and supervision and consistency in standards across the organisation. The organisation
is structured into the following principal groups:
z Retail Banking Group: The retail sales and service architecture has been organised into four geographies. These
have been further divided into zonal and regional structures. The Retail Strategy, Product & Policy Group has been
formed to develop customer-segment specific strategies, including product design and service propositions. The
Retail Banking Group is also responsible for inclusive and rural banking.
z Wholesale Banking Group, comprising the Corporate Banking Group, Commercial Banking Group, Investment
Banking Group, Project Finance Group, Financial Institutions and Capital Markets Group, Government Banking
Group and Mid-corporate & Small Enterprises Group.
35
Annual Report 2009-2010
khayaal aapka