ICICI Bank 2010 Annual Report Download - page 60
Download and view the complete annual report
Please find page 60 of the 2010 ICICI Bank annual report below. You can navigate through the pages in the report by either clicking on the pages listed below, or by using the keyword search tool below to find specific information within the annual report.-
 1
1 -
2
-
3
-
4
-
5
-
6
-
7
-
8
-
9
-
10
-
11
-
12
-
13
-
14
-
15
-
16
-
17
-
18
-
19
-
20
-
21
-
22
-
23
-
24
-
25
-
26
-
27
-
28
-
29
-
30
-
31
-
32
-
33
-
34
-
35
-
36
-
37
-
38
-
39
-
40
-
41
-
42
-
43
-
44
-
45
-
46
-
47
-
48
-
49
-
 50
50 -
 51
51 -
 52
52 -
 53
53 -
 54
54 -
 55
55 -
 56
56 -
 57
57 -
 58
58 -
 59
59 -
 60
60 -
 61
61 -
 62
62 -
 63
63 -
 64
64 -
 65
65 -
 66
66 -
 67
67 -
 68
68 -
 69
69 -
 70
70 -
71
-
72
-
73
-
74
-
75
-
76
-
77
-
78
-
79
-
80
-
81
-
82
-
83
-
84
-
85
-
86
-
87
-
88
-
89
-
90
-
91
-
92
-
93
-
94
-
95
-
96
-
97
-
98
-
99
-
100
-
101
-
102
-
103
-
104
-
105
-
106
-
107
-
108
-
109
-
110
-
111
-
112
-
113
-
114
-
115
-
116
-
117
-
118
-
119
-
120
-
121
-
122
-
123
-
124
-
125
-
126
-
127
-
128
-
129
-
130
-
131
-
132
-
133
-
134
-
135
-
136
-
137
-
138
-
139
-
140
-
141
-
142
-
143
-
144
-
145
-
146
-
147
-
148
-
149
-
150
-
151
-
152
-
153
-
154
-
155
-
156
-
157
-
158
-
159
-
160
-
161
-
162
-
163
-
164
-
165
-
166
-
167
-
168
-
169
-
170
-
171
-
172
-
173
-
174
-
175
-
176
-
177
-
178
-
179
-
180
-
181
-
182
-
183
-
184
-
185
-
186
-
187
-
188
-
189
-
190
-
191
-
192
-
193
-
194
-
195
-
196
 |
 |

Management’s Discussion and Analysis
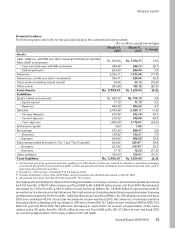
Total investments increased by 17.3% from Rs. 1,030.58 billion at year-end fiscal 2009 to Rs. 1,208.93 billion at
year-end fiscal 2010 primarily due to an increase in non-SLR investments by Rs. 128.18 billion and investments in
government and other approved securities by Rs. 50.17 billion. Non-SLR investments include net investment in
security receipts in asset reconstruction companies of Rs. 33.94 billion. During fiscal 2010, the SLR requirement
increased by 100 basis points from 24.0% to 25.0%. At year-end fiscal 2010, we had a gross portfolio of funded
credit derivatives of Rs. 15.40 billion and non-funded credit derivatives of Rs. 32.88 billion, which includes Rs.
0.22 billion as protection bought by us. The underlying exposure is entirely to Indian entities.
Our equity share capital and reserves increased from Rs. 495.33 billion at year-end fiscal 2009 to Rs. 516.18 billion
at year-end fiscal 2010 primarily due to annual accretion to reserves out of profits. Total deposits decreased by
7.5% from Rs. 2,183.48 billion at year-end fiscal 2009 to Rs. 2,020.17 billion at year-end fiscal 2010 primarily due
to our conscious strategy of reducing wholesale deposits. Term deposits decreased from Rs. 1,556.80 billion at
year-end fiscal 2009 to Rs. 1,178.01 billion at year-end fiscal 2010. Savings account deposits increased from Rs.
410.36 billion at year-end fiscal 2009 to Rs. 532.18 billion at year-end fiscal 2010 and current account deposits
increased from Rs. 216.32 billion at year-end fiscal 2009 to Rs. 309.98 billion at year-end fiscal 2010. Borrowings
(including preference share capital and subordinated debt) increased from Rs. 931.55 billion at year-end fiscal
2009 to Rs. 942.64 billion at year-end fiscal 2010 primarily on account of new capital-eligible borrowings, in the
nature of subordinated debt, offset, in part, by decrease in overseas borrowings.
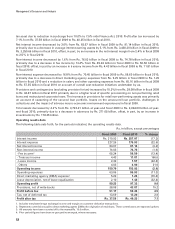
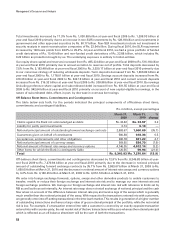
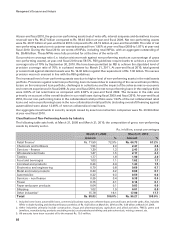
Off Balance Sheet Items, Commitments and Contingencies
The table below sets forth, for the periods indicated the principal components of off-balance sheet items,
commitments and contingent liabilities.
Rs. in billion, except percentages
March 31,
2009 March 31,
2010 %
change
Claims against the Bank not acknowledged as debts Rs. 32.82 Rs. 33.57 2.3
Liability for partly paid investments 0.13 0.13 —
Notional principal amount of outstanding forward exchange contracts 2,583.67 1,660.69 (35.7)
Guarantees given on behalf of constituents 580.88 618.36 6.5
Acceptances, endorsements and other obligations 306.78 321.22 4.7
Notional principal amount of currency swaps 569.65 524.79 (7.9)
Notional amount of Interest rate swaps and currency options 4,146.35 4,012.14 (3.2)
Other items for which the Bank is contingently liable 126.55 99.94 (21.0)
Total Rs. 8,346.83 Rs. 7,270.84 (12.9)
Off-balance sheet items, commitments and contingencies decreased by 12.9% from Rs. 8,346.83 billion at year-
end fiscal 2009 to Rs. 7,270.84 billion at year-end fiscal 2010 primarily due to the decrease in notional principal
amount of outstanding forward exchange contracts by 35.7% from Rs. 2,583.67 billion at March 31, 2009 to Rs.
1,660.69 billion at March 31, 2010 and the decrease in notional amount of interest rate swaps and currency options
by 3.2% from Rs. 4,146.35 billion at March 31, 2009 to Rs. 4,012.14 billion at March 31, 2010.
We enter into foreign exchange forwards, options, swaps and other derivative products to enable customers to
transfer, modify or reduce their foreign exchange and interest rate risk and to manage our own interest rate and
foreign exchange positions. We manage our foreign exchange and interest rate risk with reference to limits set by
RBI as well as those set internally. An interest rate swap does not entail exchange of notional principal and the cash
flow arises on account of the difference between interest rate pay and receive legs of the swaps which is generally
much smaller than the notional principal of the swap. With respect to the transactions entered into with customers,
we generally enter into off-setting transactions in the inter-bank market. This results in generation of a higher number
of outstanding transactions and hence a large value of gross notional principal of the portfolio, while the net market
risk is low. For example, if a transaction entered into with a customer is covered by an exactly opposite transaction
entered into with counter-party, the net market risk of the two transactions will be zero whereas the notional principal
which is reflected as an off-balance sheet item will be the sum of both the transactions.
58