ICICI Bank 2010 Annual Report Download - page 179
Download and view the complete annual report
Please find page 179 of the 2010 ICICI Bank annual report below. You can navigate through the pages in the report by either clicking on the pages listed below, or by using the keyword search tool below to find specific information within the annual report.-
 1
1 -
2
-
3
-
4
-
5
-
6
-
7
-
8
-
9
-
10
-
11
-
12
-
13
-
14
-
15
-
16
-
17
-
18
-
19
-
20
-
21
-
22
-
23
-
24
-
25
-
26
-
27
-
28
-
29
-
30
-
31
-
32
-
33
-
34
-
35
-
36
-
37
-
38
-
39
-
40
-
41
-
42
-
43
-
44
-
45
-
46
-
47
-
48
-
49
-
50
-
51
-
52
-
53
-
54
-
55
-
56
-
57
-
58
-
59
-
60
-
61
-
62
-
63
-
64
-
65
-
66
-
67
-
68
-
69
-
70
-
71
-
72
-
73
-
74
-
75
-
76
-
77
-
78
-
79
-
80
-
81
-
82
-
83
-
84
-
85
-
86
-
87
-
88
-
89
-
90
-
91
-
92
-
93
-
94
-
95
-
96
-
97
-
98
-
99
-
100
-
101
-
102
-
103
-
104
-
105
-
106
-
107
-
108
-
109
-
110
-
111
-
112
-
113
-
114
-
115
-
116
-
117
-
118
-
119
-
120
-
121
-
122
-
123
-
124
-
125
-
126
-
127
-
128
-
129
-
130
-
131
-
132
-
133
-
134
-
135
-
136
-
137
-
138
-
139
-
140
-
141
-
142
-
143
-
144
-
145
-
146
-
147
-
148
-
149
-
150
-
151
-
152
-
153
-
154
-
155
-
156
-
157
-
158
-
159
-
160
-
161
-
162
-
163
-
164
-
165
-
166
-
167
-
168
-
 169
169 -
 170
170 -
 171
171 -
 172
172 -
 173
173 -
 174
174 -
 175
175 -
 176
176 -
 177
177 -
 178
178 -
 179
179 -
 180
180 -
 181
181 -
 182
182 -
 183
183 -
 184
184 -
 185
185 -
 186
186 -
 187
187 -
 188
188 -
 189
189 -
190
-
191
-
192
-
193
-
194
-
195
-
196
 |
 |

F99
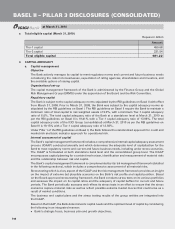
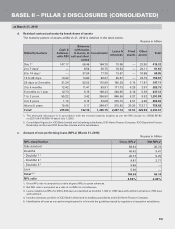
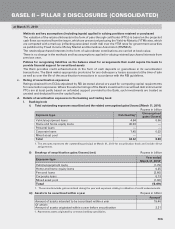
d. Residual contractual maturity break-down of assets
The maturity pattern of assets at March 31, 2010 is detailed in the table below.
Rupees in billion
Maturity buckets
Cash &
balances
with RBI
Balances
with banks
& money at
call and short
notice
Investments Loans &
advances
Fixed
assets
Other
assets Total
Day 11147.17 68.48 164.79 10.98 — 23.90 415.32
2 to 7 days1— 8.54 30.75 18.23 — 24.11 81.63
8 to 14 days1— 27.64 17.76 13.67 — 10.88 69.95
15 to 28 days 10.42 13.80 83.97 26.67 — 23.15 158.01
29 days to 3 months 21.24 52.53 110.99 150.38 0.16 11.81 347.11
3 to 6 months 12.42 11.41 83.91 171.73 0.29 2.97 282.73
6 months to 1 year 12.73 6.16 108.33 304.60 0.10 5.39 437.31
1 to 3 years 55.22 3.42 356.50 866.56 0.27 9.92 1,291.89
3 to 5 years 1.15 0.15 63.68 379.10 2.51 4.25 450.84
Above 5 years 15.45 0.17 284.47 315.82 30.20 112.71 758.82
Total2275.80 192.30 1,305.15 2,257.74 33.53 229.09 4,293.61
1. The aforesaid disclosure is in accordance with the revised maturity buckets as per the RBI circular no. DBOD.BP.BC
no.22/21.04.018/2009-10 dated July 1, 2009.
2. Consolidated figures for ICICI Bank Limited and its banking subsidiaries, ICICI Home Finance Company, ICICI Securities Primary
Dealership Limited and ICICI Securities Limited and its subsidiaries.
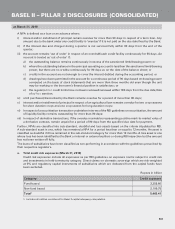
e. Amount of non-performing loans (NPLs) (March 31, 2010)
Rupees in billion
NPL classification Gross NPLs1Net NPLs2
Sub-standard 58.63 36.73
Doubtful 40.43 9.41
- Doubtful 1 320.77 5.70
- Doubtful 2 39.81 3.71
- Doubtful 3 39.85 —
Loss 5.30 —
Total 4, 5 104.36 46.14
NPL ratio 4.50% 2.04%
1. Gross NPL ratio is computed as a ratio of gross NPLs to gross advances.
2. Net NPL ratio is computed as a ratio of net NPLs to net advances.
3. Loans classified as NPLs for 456 to 820 days are classified as Doubtful 1, 820 to 1,550 days as Doubtful 2 and above 1,550 days
as Doubtful 3.
4. Includes advances portfolio of ICICI Bank Limited and its banking subsidiaries and ICICI Home Finance Company.
5. Identification of loans as non-performing/impaired is in line with the guidelines issued by regulators of respective subsidiaries.
BASEL II – PILLAR 3 DISCLOSURES (CONSOLIDATED)
at March 31, 2010