ICICI Bank 2010 Annual Report Download - page 54
Download and view the complete annual report
Please find page 54 of the 2010 ICICI Bank annual report below. You can navigate through the pages in the report by either clicking on the pages listed below, or by using the keyword search tool below to find specific information within the annual report.-
 1
1 -
2
-
3
-
4
-
5
-
6
-
7
-
8
-
9
-
10
-
11
-
12
-
13
-
14
-
15
-
16
-
17
-
18
-
19
-
20
-
21
-
22
-
23
-
24
-
25
-
26
-
27
-
28
-
29
-
30
-
31
-
32
-
33
-
34
-
35
-
36
-
37
-
38
-
39
-
40
-
41
-
42
-
43
-
 44
44 -
 45
45 -
 46
46 -
 47
47 -
 48
48 -
 49
49 -
 50
50 -
 51
51 -
 52
52 -
 53
53 -
 54
54 -
 55
55 -
 56
56 -
 57
57 -
 58
58 -
 59
59 -
 60
60 -
 61
61 -
 62
62 -
 63
63 -
 64
64 -
65
-
66
-
67
-
68
-
69
-
70
-
71
-
72
-
73
-
74
-
75
-
76
-
77
-
78
-
79
-
80
-
81
-
82
-
83
-
84
-
85
-
86
-
87
-
88
-
89
-
90
-
91
-
92
-
93
-
94
-
95
-
96
-
97
-
98
-
99
-
100
-
101
-
102
-
103
-
104
-
105
-
106
-
107
-
108
-
109
-
110
-
111
-
112
-
113
-
114
-
115
-
116
-
117
-
118
-
119
-
120
-
121
-
122
-
123
-
124
-
125
-
126
-
127
-
128
-
129
-
130
-
131
-
132
-
133
-
134
-
135
-
136
-
137
-
138
-
139
-
140
-
141
-
142
-
143
-
144
-
145
-
146
-
147
-
148
-
149
-
150
-
151
-
152
-
153
-
154
-
155
-
156
-
157
-
158
-
159
-
160
-
161
-
162
-
163
-
164
-
165
-
166
-
167
-
168
-
169
-
170
-
171
-
172
-
173
-
174
-
175
-
176
-
177
-
178
-
179
-
180
-
181
-
182
-
183
-
184
-
185
-
186
-
187
-
188
-
189
-
190
-
191
-
192
-
193
-
194
-
195
-
196
 |
 |

Management’s Discussion and Analysis
tax asset due to reduction in surcharge from 10.0% to 7.5% vide Finance Act, 2010. Profit after tax increased by
7.1% from Rs. 37.58 billion in fiscal 2009 to Rs. 40.25 billion in fiscal 2010.
Net interest income decreased by 3.0% from Rs. 83.67 billion in fiscal 2009 to Rs. 81.14 billion in fiscal 2010,
primarily due to a decrease in average interest-earning assets by 5.1% from Rs. 3,436.20 billion in fiscal 2009 to
Rs. 3,259.66 billion in fiscal 2010, offset, in part, by an increase in the net interest margin from 2.4% in fiscal 2009
to 2.5% in fiscal 2010.
Non-interest income decreased by 1.6% from Rs. 76.03 billion in fiscal 2009 to Rs. 74.78 billion in fiscal 2010,
primarily due to a decrease in fee income by 13.4% from Rs. 65.24 billion in fiscal 2009 to Rs. 56.50 billion in
fiscal 2010, offset, in part by an increase in treasury income from Rs. 4.43 billion in fiscal 2009 to Rs. 11.81 billion
in fiscal 2010.
Non-interest expense decreased by 16.8% from Rs. 70.45 billion in fiscal 2009 to Rs. 58.60 billion in fiscal 2010,
primarily due to a decrease in direct marketing agency expenses from Rs. 5.29 billion in fiscal 2009 to Rs. 1.25
billion in fiscal 2010 and a reduction in salary and other operating expenses from Rs. 65.16 billion in fiscal 2009
to Rs. 57.35 billion in fiscal 2010 on account of overall cost reduction initiatives undertaken by us.
Provisions and contingencies (excluding provision for tax) increased by 15.2% from Rs. 38.08 billion in fiscal 2009
to Rs. 43.87 billion in fiscal 2010 primarily due to a higher level of specific provisioning on non-performing retail
loans and restructured corporate loans. The increase in provisions for retail non-performing assets was primarily
on account of seasoning of the secured loan portfolio, losses on the unsecured loan portfolio, challenges in
collections and the impact of adverse macro-economic environment experienced in fiscal 2009.
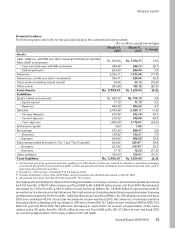
Total assets decreased by 4.2% from Rs. 3,793.01 billion at year-end fiscal 2009 to Rs. 3,634.00 billion at year-
end fiscal 2010, primarily due to a decrease in advances by Rs. 371.05 billion, offset, in part, by an increase in
investments by Rs. 178.35 billion.
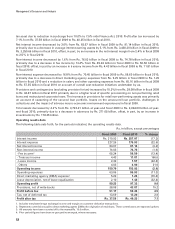
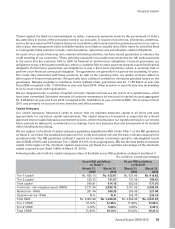
Operating results data
The following table sets forth, for the periods indicated, the operating results data.
Rs. in billion, except percentages
Fiscal 2009 Fiscal 2010 % change
Interest income Rs. 310.93 Rs. 257.07 (17.3)
Interest expense 227.26 175.93 (22.6)
Net interest income 83.67 81.14 (3.0)
Non-interest income 76.03 74.78 (1.6)
- Fee income165.24 56.50 (13.4)
- Treasury income 4.43 11.81 166.6
- Lease income 2.33 1.57 (32.6)
- Others 4.03 4.90 21.6
Operating income 159.70 155.92 (2.4)
Operating expenses 63.06 55.93 (11.3)
Direct marketing agency (DMA) expense 2 5.29 1.25 (76.4)
Lease depreciation, net of lease equalisation 2.10 1.42 (32.4)
Operating profit 89.25 97.32 9.0
Provisions, net of write-backs 38.08 43.87 15.2
Profit before tax 51.17 53.45 4.5
Tax, net of deferred tax 13.59 13.20 2.9
Profit after tax Rs. 37.58 Rs. 40.25 7.1
1. Includes merchant foreign exchange income and margin on customer derivative transactions.
2. Represents commissions paid to direct marketing agents (DMAs) for origination of retail loans. These commissions are expensed upfront.
3. All amounts have been rounded off to the nearest Rs. 10.0 million.
4. Prior period figures have been re-grouped/re-arranged, where necessary.
52