ICICI Bank 2010 Annual Report Download - page 154
Download and view the complete annual report
Please find page 154 of the 2010 ICICI Bank annual report below. You can navigate through the pages in the report by either clicking on the pages listed below, or by using the keyword search tool below to find specific information within the annual report.-
 1
1 -
2
-
3
-
4
-
5
-
6
-
7
-
8
-
9
-
10
-
11
-
12
-
13
-
14
-
15
-
16
-
17
-
18
-
19
-
20
-
21
-
22
-
23
-
24
-
25
-
26
-
27
-
28
-
29
-
30
-
31
-
32
-
33
-
34
-
35
-
36
-
37
-
38
-
39
-
40
-
41
-
42
-
43
-
44
-
45
-
46
-
47
-
48
-
49
-
50
-
51
-
52
-
53
-
54
-
55
-
56
-
57
-
58
-
59
-
60
-
61
-
62
-
63
-
64
-
65
-
66
-
67
-
68
-
69
-
70
-
71
-
72
-
73
-
74
-
75
-
76
-
77
-
78
-
79
-
80
-
81
-
82
-
83
-
84
-
85
-
86
-
87
-
88
-
89
-
90
-
91
-
92
-
93
-
94
-
95
-
96
-
97
-
98
-
99
-
100
-
101
-
102
-
103
-
104
-
105
-
106
-
107
-
108
-
109
-
110
-
111
-
112
-
113
-
114
-
115
-
116
-
117
-
118
-
119
-
120
-
121
-
122
-
123
-
124
-
125
-
126
-
127
-
128
-
129
-
130
-
131
-
132
-
133
-
134
-
135
-
136
-
137
-
138
-
139
-
140
-
141
-
142
-
143
-
 144
144 -
 145
145 -
 146
146 -
 147
147 -
 148
148 -
 149
149 -
 150
150 -
 151
151 -
 152
152 -
 153
153 -
 154
154 -
 155
155 -
 156
156 -
 157
157 -
 158
158 -
 159
159 -
 160
160 -
 161
161 -
 162
162 -
 163
163 -
 164
164 -
165
-
166
-
167
-
168
-
169
-
170
-
171
-
172
-
173
-
174
-
175
-
176
-
177
-
178
-
179
-
180
-
181
-
182
-
183
-
184
-
185
-
186
-
187
-
188
-
189
-
190
-
191
-
192
-
193
-
194
-
195
-
196
 |
 |

F74
schedules
forming part of the Consolidated Accounts (Contd.)
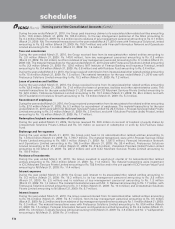
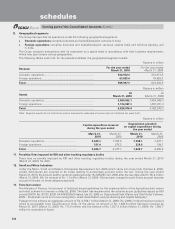
The following table sets forth, for the years indicated, the balance payable to/receivable from relatives of key management
personnel.
Rupees in million
Items At
March 31, 2010 At
March 31, 2009
Deposits with the Group ......................................................................... 16.9 17.2
Advances ................................................................................................. 8.1 7.5
Investments............................................................................................. ——
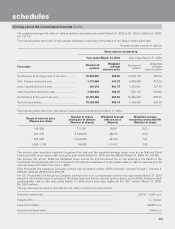
The following table sets forth, for the years indicated, the maximum balance payable to/receivable from key management
personnel.
Rupees in million
Items Year ended
March 31, 2010 Year ended
March 31, 2009
Deposits with the Group ......................................................................... 66.1 123.7
Advances ................................................................................................. 26.1 63.6
Investments............................................................................................. 9.1 9.3
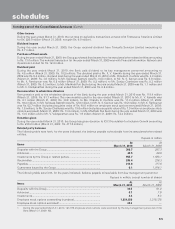
The following table sets forth, for the years indicated, the maximum balance payable to/receivable from relatives of key
management personnel.
Rupees in million
Items Year ended
March 31, 2010 Year ended
March 31, 2009
Deposits with the Group ......................................................................... 23.2 38.3
Advances ................................................................................................. 12.2 7.6
Investments............................................................................................. 0.3 —
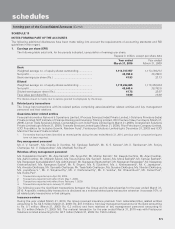
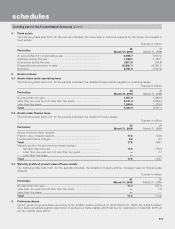
3. Employee stock option scheme (ESOS)
In terms of the ESOS, as amended, the maximum number of options granted to any eligible employee in a financial year
shall not exceed 0.05% of the issued equity shares of the Bank at the time of grant of the options and aggregate of all such
options granted to the eligible employees shall not exceed 5.0% of the aggregate number of the issued equity shares of
the Bank on the date(s) of the grant of options. Under the stock option scheme, eligible employees are entitled to apply
for equity shares. Options granted in April 2009 vest in a graded manner over a five year period with 20.0%, 20.0%, 30.0%
and 30.0% of grant vesting each year, commencing from the end of 24 months from the date of grant. The options can be
exercised within 10 years from the date of grant or five years from the date of vesting, whichever is later. No options have
been granted to wholetime Directors for fiscal 2009.
In terms of the Scheme, 18,763,460 options (March 31, 2009: 18,992,504 options) granted to eligible employees were
outstanding at March 31, 2010.
As per the scheme, the exercise price of the Bank’s options is the last closing price on the stock exchange, which recorded
highest trading volume preceding the date of grant of options. Hence, there is no compensation cost in the year ended
March 31, 2010 based on the intrinsic value of options. However, if the Bank had used the fair value of options based on
the Black-Scholes model, compensation cost in the year ended March 31, 2010 would have been higher by Rs. 901.2 million
and the proforma profit after tax would have been Rs. 39.35 billion.
The following table sets forth, the key assumptions used to estimate the fair value of options granted during the year ended
March 31, 2010.
Risk-free interest rate .............................................................................. 6.53% to 7.76%
Expected life ........................................................................................... 6.35 to 6.85 years
Expected volatility ................................................................................... 48.65% to 49.18%
Expected dividend yield .......................................................................... 1.22% to 2.53%