ICICI Bank 2010 Annual Report Download - page 178
Download and view the complete annual report
Please find page 178 of the 2010 ICICI Bank annual report below. You can navigate through the pages in the report by either clicking on the pages listed below, or by using the keyword search tool below to find specific information within the annual report.-
 1
1 -
2
-
3
-
4
-
5
-
6
-
7
-
8
-
9
-
10
-
11
-
12
-
13
-
14
-
15
-
16
-
17
-
18
-
19
-
20
-
21
-
22
-
23
-
24
-
25
-
26
-
27
-
28
-
29
-
30
-
31
-
32
-
33
-
34
-
35
-
36
-
37
-
38
-
39
-
40
-
41
-
42
-
43
-
44
-
45
-
46
-
47
-
48
-
49
-
50
-
51
-
52
-
53
-
54
-
55
-
56
-
57
-
58
-
59
-
60
-
61
-
62
-
63
-
64
-
65
-
66
-
67
-
68
-
69
-
70
-
71
-
72
-
73
-
74
-
75
-
76
-
77
-
78
-
79
-
80
-
81
-
82
-
83
-
84
-
85
-
86
-
87
-
88
-
89
-
90
-
91
-
92
-
93
-
94
-
95
-
96
-
97
-
98
-
99
-
100
-
101
-
102
-
103
-
104
-
105
-
106
-
107
-
108
-
109
-
110
-
111
-
112
-
113
-
114
-
115
-
116
-
117
-
118
-
119
-
120
-
121
-
122
-
123
-
124
-
125
-
126
-
127
-
128
-
129
-
130
-
131
-
132
-
133
-
134
-
135
-
136
-
137
-
138
-
139
-
140
-
141
-
142
-
143
-
144
-
145
-
146
-
147
-
148
-
149
-
150
-
151
-
152
-
153
-
154
-
155
-
156
-
157
-
158
-
159
-
160
-
161
-
162
-
163
-
164
-
165
-
166
-
167
-
 168
168 -
 169
169 -
 170
170 -
 171
171 -
 172
172 -
 173
173 -
 174
174 -
 175
175 -
 176
176 -
 177
177 -
 178
178 -
 179
179 -
 180
180 -
 181
181 -
 182
182 -
 183
183 -
 184
184 -
 185
185 -
 186
186 -
 187
187 -
 188
188 -
189
-
190
-
191
-
192
-
193
-
194
-
195
-
196
 |
 |
F98
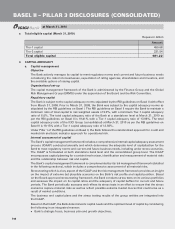
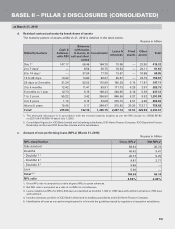
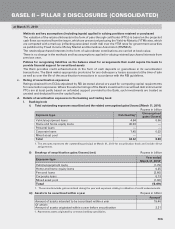
b. Geographic distribution of exposures (March 31, 2010)
Rupees in billion
Category Fund-based Non-fund based
Domestic 2,385.56 1,846.63
Overseas 970.10 263.12
Total13,355.66 2,109.75
1. Includes all entities considered for Basel II capital adequacy computation.
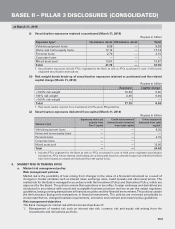
c. Industry-wise distribution of exposures (March 31, 2010)
Rupees in billion
Industry Fund-based Non-fund based
Retail finance11,135.91 32.35
Banks2215.22 296.36
Electronics and engineering 74.24 312.59
Crude petroleum/refining and petrochemicals 157.59 218.63
Services – non-finance 243.35 132.31
Services - finance 246.74 95.85
Road, port, telecom, urban development and other infrastructure 121.89 214.17
Iron/steel and products 114.06 122.64
Power 111.26 111.50
Metal and products (excluding iron and steel) 48.65 125.95
Construction 28.14 122.92
Food and beverages 121.57 29.40
Mutual funds 128.97 0.83
Wholesale/retail trade 73.62 46.11
Chemical and fertilisers 78.77 37.38
Drugs and pharmaceuticals 36.92 21.66
Cement 32.36 23.23
Shipping 23.38 31.25
Automobiles 27.60 26.69
Gems and jewellery 30.76 13.35
Manufacturing products (excluding metals) 30.37 12.46
Textiles 29.76 8.27
Mining 28.23 8.82
FMCG 22.19 2.33
Venture capital funds 2.61 0.06
Other industries 191.50 62.64
Total33,355.66 2,109.75
1. Includes home loans, automobile loans, commercial business loans, two wheeler loans, personal loans, credit cards, dealer
funding (Rs. 11.60 billion) and developer financing (Rs. 55.31 billion).
2. Includes balances with banks.
3. Includes all entities considered for Basel II capital adequacy computation.
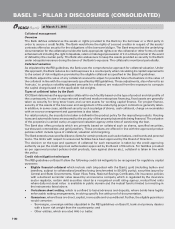
BASEL II – PILLAR 3 DISCLOSURES (CONSOLIDATED)
at March 31, 2010