ICICI Bank 2010 Annual Report Download - page 113
Download and view the complete annual report
Please find page 113 of the 2010 ICICI Bank annual report below. You can navigate through the pages in the report by either clicking on the pages listed below, or by using the keyword search tool below to find specific information within the annual report.-
 1
1 -
2
-
3
-
4
-
5
-
6
-
7
-
8
-
9
-
10
-
11
-
12
-
13
-
14
-
15
-
16
-
17
-
18
-
19
-
20
-
21
-
22
-
23
-
24
-
25
-
26
-
27
-
28
-
29
-
30
-
31
-
32
-
33
-
34
-
35
-
36
-
37
-
38
-
39
-
40
-
41
-
42
-
43
-
44
-
45
-
46
-
47
-
48
-
49
-
50
-
51
-
52
-
53
-
54
-
55
-
56
-
57
-
58
-
59
-
60
-
61
-
62
-
63
-
64
-
65
-
66
-
67
-
68
-
69
-
70
-
71
-
72
-
73
-
74
-
75
-
76
-
77
-
78
-
79
-
80
-
81
-
82
-
83
-
84
-
85
-
86
-
87
-
88
-
89
-
90
-
91
-
92
-
93
-
94
-
95
-
96
-
97
-
98
-
99
-
100
-
101
-
102
-
 103
103 -
 104
104 -
 105
105 -
 106
106 -
 107
107 -
 108
108 -
 109
109 -
 110
110 -
 111
111 -
 112
112 -
 113
113 -
 114
114 -
 115
115 -
 116
116 -
 117
117 -
 118
118 -
 119
119 -
 120
120 -
 121
121 -
 122
122 -
 123
123 -
124
-
125
-
126
-
127
-
128
-
129
-
130
-
131
-
132
-
133
-
134
-
135
-
136
-
137
-
138
-
139
-
140
-
141
-
142
-
143
-
144
-
145
-
146
-
147
-
148
-
149
-
150
-
151
-
152
-
153
-
154
-
155
-
156
-
157
-
158
-
159
-
160
-
161
-
162
-
163
-
164
-
165
-
166
-
167
-
168
-
169
-
170
-
171
-
172
-
173
-
174
-
175
-
176
-
177
-
178
-
179
-
180
-
181
-
182
-
183
-
184
-
185
-
186
-
187
-
188
-
189
-
190
-
191
-
192
-
193
-
194
-
195
-
196
 |
 |

F33
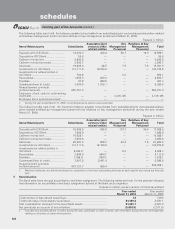
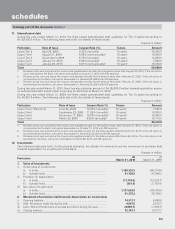
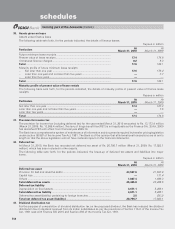
ii) Non-performing investments in securities, other than government and other approved securities
The following table sets forth, for the periods indicated, the movement in gross non-performing investments in securities,
other than government and other approved securities.
Rupees in million
Particulars Year ended
March 31, 2010
Year ended
March 31, 2009
Opening balance ..................................................................................... 3,829.1 3,689.6
Additions during the year ........................................................................ 2,626.3 278.7
Reduction during the year ....................................................................... (1,236.1) (139.2)
Closing balance ....................................................................................... 5,219.3 3,829.1
Total provision held ................................................................................. 3,599.8 3,213.8
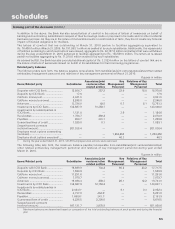
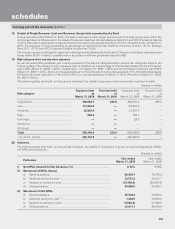
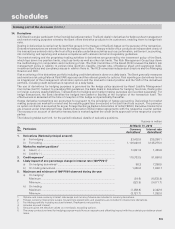
14. Repurchase transactions
The following table sets forth, for the periods indicated, the details of securities sold and purchased under repos and reverse
repos.
Rupees in million
Minimum
outstanding
balance during
the year
Maximum
outstanding
balance during
the year
Daily average
outstanding
balance during
the year
Balance at
year end
Year ended March 31, 2010
Securities sold under repurchase transaction ............. — 304,922.4 160,895.7 27,301.0
Securities purchased under reverse
repurchase transaction ................................................ — — — —
Year ended March 31, 2009
Securities sold under repurchase transaction ............. — 145,875.0 66,861.3 22,092.3
Securities purchased under reverse
repurchase transaction ................................................ — 10,499.7 31.5 —
1. The above figures do not include securities sold and purchased under Liquidity Adjustment Facility (LAF) of RBI.
2. The above figures are for Indian branches only.
3. Minimum, maximum & average outstanding is based on first leg of transaction & balance outstanding is based on book value.
4. Corporate debt securities sold and purchased under repo and reverse repo transactions is Nil.
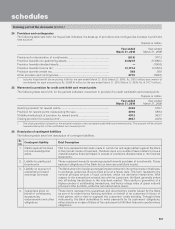
15. Reconciliation of nostro account
In terms of RBI circular no. DBOD.BP.BC.No. 133/21.04.018/2008-09 dated May 11, 2009, Rs. 10.4 million representing
outstanding credit balances of individual value less than USD 2,500 or equivalent lying in nostro account, which were
originated up to March 31, 2002 and parked in blocked account, was transferred to profit and loss account during the year
ended March 31, 2010.
16. CBLO transactions
Collateralised Borrowing and Lending Obligation (CBLO) is a discounted money market instrument, developed by The Clearing
Corporation of India Limited (CCIL) and approved by RBI which involves secured borrowings and lending transactions. At
March 31, 2010, the Bank had outstanding borrowings amounting to Nil and outstanding lending amounting to Nil in the
form of CBLO. The amortised book value of securities given as collateral by the Bank to CCIL for availing the CBLO facility
was Rs. 44,699.4 million at March 31, 2010.
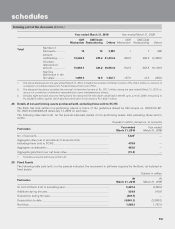
17. Lending to sensitive sectors
The Bank has lending to sectors, which are sensitive to asset price fluctuations. The sensitive sectors include capital markets
and real estate.
schedules
forming part of the Accounts (Contd.)