ICICI Bank 2010 Annual Report Download - page 53
Download and view the complete annual report
Please find page 53 of the 2010 ICICI Bank annual report below. You can navigate through the pages in the report by either clicking on the pages listed below, or by using the keyword search tool below to find specific information within the annual report.-
 1
1 -
2
-
3
-
4
-
5
-
6
-
7
-
8
-
9
-
10
-
11
-
12
-
13
-
14
-
15
-
16
-
17
-
18
-
19
-
20
-
21
-
22
-
23
-
24
-
25
-
26
-
27
-
28
-
29
-
30
-
31
-
32
-
33
-
34
-
35
-
36
-
37
-
38
-
39
-
40
-
41
-
42
-
 43
43 -
 44
44 -
 45
45 -
 46
46 -
 47
47 -
 48
48 -
 49
49 -
 50
50 -
 51
51 -
 52
52 -
 53
53 -
 54
54 -
 55
55 -
 56
56 -
 57
57 -
 58
58 -
 59
59 -
 60
60 -
 61
61 -
 62
62 -
 63
63 -
64
-
65
-
66
-
67
-
68
-
69
-
70
-
71
-
72
-
73
-
74
-
75
-
76
-
77
-
78
-
79
-
80
-
81
-
82
-
83
-
84
-
85
-
86
-
87
-
88
-
89
-
90
-
91
-
92
-
93
-
94
-
95
-
96
-
97
-
98
-
99
-
100
-
101
-
102
-
103
-
104
-
105
-
106
-
107
-
108
-
109
-
110
-
111
-
112
-
113
-
114
-
115
-
116
-
117
-
118
-
119
-
120
-
121
-
122
-
123
-
124
-
125
-
126
-
127
-
128
-
129
-
130
-
131
-
132
-
133
-
134
-
135
-
136
-
137
-
138
-
139
-
140
-
141
-
142
-
143
-
144
-
145
-
146
-
147
-
148
-
149
-
150
-
151
-
152
-
153
-
154
-
155
-
156
-
157
-
158
-
159
-
160
-
161
-
162
-
163
-
164
-
165
-
166
-
167
-
168
-
169
-
170
-
171
-
172
-
173
-
174
-
175
-
176
-
177
-
178
-
179
-
180
-
181
-
182
-
183
-
184
-
185
-
186
-
187
-
188
-
189
-
190
-
191
-
192
-
193
-
194
-
195
-
196
 |
 |

Management’s Discussion & Analysis
BACKGROUND
The economic environment in India improved significantly during fiscal 2010 with growth reviving following the
moderation in fiscal 2009. The Index of Industrial Production increased by 10.4% during fiscal 2010 compared to
2.7% during fiscal 2009. Exports growth also turned positive from October 2009 after declining for 12 consecutive
months. Net FII inflows into India revived to US$ 23.6 billion during April-December 2009 compared to net outflows
of US$ 11.3 billion during the corresponding period in the previous year. The growth in gross domestic product
(GDP) during the first half of fiscal 2010 was 7.0% compared to 6.0% during the second half of fiscal 2009. During
the third quarter of fiscal 2010, GDP growth moderated to 6.0% mainly due to a 2.8% decline in agricultural output
following below normal monsoons, and moderation in services sector growth to 6.6%. The Central Statistical
Organisation (CSO) has placed advance estimates of GDP growth for fiscal 2010 at 7.2%.
During the second half of fiscal 2010, inflationary pressures increased driven largely by food price inflation.
Inflation as measured by the wholesale price index increased from a low of –1.0% in June 2009 to 9.9% in March
2010. In view of inflationary pressures and the recovery in economic activity, the Reserve Bank of India (RBI)
commenced the exit of the accommodative stance adopted in response to the global financial crisis. RBI increased
the statutory liquidity ratio (SLR) by 100 basis points from 24.0% to 25.0% in October 2009, the cash reserve
ratio (CRR) by 75 basis points to 5.75% in February 2010 and the repo and reverse repo rates by 25 basis points
each to 5.0% and 3.5% respectively in March 2010. The RBI in its annual policy review in April 2010 announced a
further increase of 25 basis points each in CRR to 6.0%, repo rate to 5.25% and reverse repo rate to 3.75%. As a
result of inflationary concerns, increased policy rates and the large government borrowing programme, the yield
on 10-year government securities increased by 81 basis points from 7.01% at March 31, 2009 to 7.82% at March
31, 2010. During fiscal 2010, equity markets recovered significantly with the BSE Sensex increasing by 80.5%
from 9,709 at March 31, 2009 to 17,528 at March 31, 2010. The rupee appreciated from Rs. 51.0 per US dollar at
year-end fiscal 2009 to Rs. 45.1 per US dollar at year-end fiscal 2010.
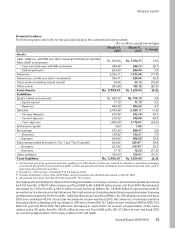
The trends in the economy were also reflected in the banking sector. Non-food credit growth at end December
2009 was 12.7% on a year-on-year basis as compared to 17.8% at March 2009. There was some revival in credit
growth during the fourth quarter of fiscal 2010 with non-food credit growth reaching 16.9% at end-fiscal 2010.
Growth in total deposits moderated from 19.9% on a year-on-year basis at end-fiscal 2009 to 17.0% at year-end
fiscal 2010. The moderation was due to a lower growth of 16.2% in term deposits during fiscal 2010 compared to
23.9% in fiscal 2009 while demand deposits increased by 22.2% compared to a decline of 0.2% in fiscal 2009.
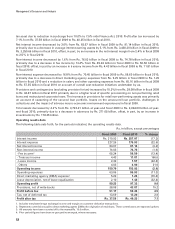
STANDALONE FINANCIALS AS PER INDIAN GAAP
Summary
During fiscal 2010, we accorded priority to improving our low cost deposit base, conserving capital, improving cost
efficiency and improving our credit quality. The key elements of our strategy for fiscal 2011 will include continued
growth in CASA and retail term deposits, capitalising on opportunities in select asset segments including home
loans, other secured retail loans, project finance and commercial banking activities, maintaining cost efficiency
even as absolute level of expenses is expected to increase in line with business growth and continued focus on
reduction in credit losses.
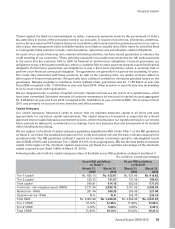
Profit before provisions and tax increased by 9.0% from Rs. 89.25 billion in fiscal 2009 to Rs. 97.32 billion in
fiscal 2010 primarily due to an increase in treasury income from Rs. 4.43 billion in fiscal 2009 to Rs. 11.81 billion
in fiscal 2010 and a 16.8% decrease in non-interest expenses from Rs. 70.45 billion in fiscal 2009 to Rs. 58.60
billion in fiscal 2010, offset, in part, by a 3.0% decrease in net interest income from Rs. 83.67 billion in fiscal 2009
to Rs. 81.14 billion in fiscal 2010 and a 13.4% decrease in fee income from Rs. 65.24 billion in fiscal 2009 to Rs.
56.50 billion in fiscal 2010. Provisions and contingencies (excluding provision for tax) increased by 15.2% from
Rs. 38.08 billion in fiscal 2009 to Rs. 43.87 billion in fiscal 2010 due to a higher level of specific provisioning on
non-performing retail loans and restructured corporate loans. Profit before tax increased by 4.5% from Rs. 51.17
billion in fiscal 2009 to Rs. 53.45 billion in fiscal 2010. Tax provision decreased from Rs. 13.59 billion in fiscal 2009
to Rs. 13.20 billion in fiscal 2010 primarily due to a change in the mix of taxable profits with a higher component
of exempt income, abolition of fringe benefit tax, offset, in part, by a negative impact of revaluation of deferred
51
Annual Report 2009-2010
khayaal aapka