ICICI Bank 2010 Annual Report Download - page 57
Download and view the complete annual report
Please find page 57 of the 2010 ICICI Bank annual report below. You can navigate through the pages in the report by either clicking on the pages listed below, or by using the keyword search tool below to find specific information within the annual report.-
 1
1 -
2
-
3
-
4
-
5
-
6
-
7
-
8
-
9
-
10
-
11
-
12
-
13
-
14
-
15
-
16
-
17
-
18
-
19
-
20
-
21
-
22
-
23
-
24
-
25
-
26
-
27
-
28
-
29
-
30
-
31
-
32
-
33
-
34
-
35
-
36
-
37
-
38
-
39
-
40
-
41
-
42
-
43
-
44
-
45
-
46
-
 47
47 -
 48
48 -
 49
49 -
 50
50 -
 51
51 -
 52
52 -
 53
53 -
 54
54 -
 55
55 -
 56
56 -
 57
57 -
 58
58 -
 59
59 -
 60
60 -
 61
61 -
 62
62 -
 63
63 -
 64
64 -
 65
65 -
 66
66 -
 67
67 -
68
-
69
-
70
-
71
-
72
-
73
-
74
-
75
-
76
-
77
-
78
-
79
-
80
-
81
-
82
-
83
-
84
-
85
-
86
-
87
-
88
-
89
-
90
-
91
-
92
-
93
-
94
-
95
-
96
-
97
-
98
-
99
-
100
-
101
-
102
-
103
-
104
-
105
-
106
-
107
-
108
-
109
-
110
-
111
-
112
-
113
-
114
-
115
-
116
-
117
-
118
-
119
-
120
-
121
-
122
-
123
-
124
-
125
-
126
-
127
-
128
-
129
-
130
-
131
-
132
-
133
-
134
-
135
-
136
-
137
-
138
-
139
-
140
-
141
-
142
-
143
-
144
-
145
-
146
-
147
-
148
-
149
-
150
-
151
-
152
-
153
-
154
-
155
-
156
-
157
-
158
-
159
-
160
-
161
-
162
-
163
-
164
-
165
-
166
-
167
-
168
-
169
-
170
-
171
-
172
-
173
-
174
-
175
-
176
-
177
-
178
-
179
-
180
-
181
-
182
-
183
-
184
-
185
-
186
-
187
-
188
-
189
-
190
-
191
-
192
-
193
-
194
-
195
-
196
 |
 |

Our net interest margin is expected to continue to be lower than other banks in India until we increase the
proportion of retail deposits in our total funding. Our net interest margin is also impacted by the relatively lower
margins on our international book.
NON-INTEREST INCOME
Fee income
Fee income decreased by 13.4% from Rs. 65.24 billion in fiscal 2009 to Rs. 56.50 billion in fiscal 2010 primarily due to
subdued credit demand from the corporate sector in fiscal 2010 resulting in lower loan processing fees and moderation
in retail disbursements resulted in lower retail asset (including credit cards) related fees in fiscal 2010 as compared
to fiscal 2009. Retail liabilities related fees increased marginally in fiscal 2010 as compared to fiscal 2009.
Treasury income
Treasury income increased from Rs. 4.43 billion in fiscal 2009 to Rs. 11.81 billion in fiscal 2010. Treasury income for
fiscal 2010 includes income on investments in government of India securities and other fixed income instruments,
reversal of mark-to-market (MTM) provision on credit derivatives and gains from realised profit and reversal of
mark-to-market provision held on equity investments, offset, in part by loss on security receipts.
We offer various derivative products to our clients for their risk management purposes including options and
swaps. We do not carry market risk on these client derivative positions as we cover ourselves in the inter-bank
market. Profits or losses on account of currency movements on these transactions are borne by the clients. In
some cases, clients have filed suits against us disputing the transactions and the amounts to be paid. There have
been delays in payment to us in respect of some of these clients. We have fully reversed the income recognised
in cases where receivables are overdue for more than 90 days.
Lease & other income
Lease income, net of lease depreciation, decreased by 34.8% from Rs. 0.23 billion in fiscal 2009 to Rs. 0.15 billion
in fiscal 2010 primarily due to reduction in leased assets from Rs. 4.62 billion at year-end fiscal 2009 to Rs. 3.53
billion at year-end fiscal 2010.
Other income increased by 21.6% from Rs. 4.03 billion in fiscal 2009 to Rs. 4.90 billion in fiscal 2010. Other income
primarily includes dividend from subsidiaries and profit/loss on sale of fixed and other assets.
During fiscal 2010, the Bank and First Data, a global leader in electronic commerce and payment services, formed
a merchant acquiring alliance and a new entity, 81% owned by First Data, was formed, which has acquired ICICI
Bank’s merchant acquiring operations through transfer of assets, primarily comprising fixed assets and receivables,
for a total consideration of Rs. 3.74 billion. We realised a profit of Rs. 2.03 billion from this transaction, which is
included in “Other income”.
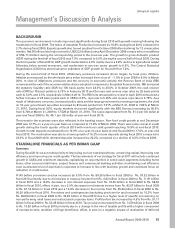
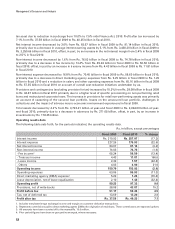
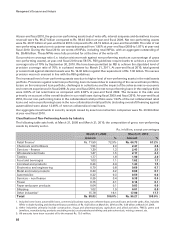
Non-interest expense
The following table sets forth, for the periods indicated, the principal components of non-interest expense.
Rs. in billion, except percentages
Fiscal 2009 Fiscal 2010 % change
Employee expenses Rs. 19.72 Rs. 19.26 (2.3)
Depreciation on own property (including non banking assets) 4.68 4.78 2.1
Auditors’ fees and expenses 0.02 0.02 —
Other administrative expenses 38.64 31.87 (17.5)
Total non-interest expense (excluding lease depreciation
and direct marketing agency expenses) 63.06 55.93 (11.3)
Depreciation (net of lease equalisation) on leased assets 2.10 1.42 (32.4)
Direct marketing agency expenses 5.29 1.25 (76.4)
Total non-interest expense Rs. 70.45 Rs. 58.60 (16.8)
1. All amounts have been rounded off to the nearest Rs. 10.0 million.
55
Annual Report 2009-2010
khayaal aapka