ICICI Bank 2010 Annual Report Download - page 162
Download and view the complete annual report
Please find page 162 of the 2010 ICICI Bank annual report below. You can navigate through the pages in the report by either clicking on the pages listed below, or by using the keyword search tool below to find specific information within the annual report.-
 1
1 -
2
-
3
-
4
-
5
-
6
-
7
-
8
-
9
-
10
-
11
-
12
-
13
-
14
-
15
-
16
-
17
-
18
-
19
-
20
-
21
-
22
-
23
-
24
-
25
-
26
-
27
-
28
-
29
-
30
-
31
-
32
-
33
-
34
-
35
-
36
-
37
-
38
-
39
-
40
-
41
-
42
-
43
-
44
-
45
-
46
-
47
-
48
-
49
-
50
-
51
-
52
-
53
-
54
-
55
-
56
-
57
-
58
-
59
-
60
-
61
-
62
-
63
-
64
-
65
-
66
-
67
-
68
-
69
-
70
-
71
-
72
-
73
-
74
-
75
-
76
-
77
-
78
-
79
-
80
-
81
-
82
-
83
-
84
-
85
-
86
-
87
-
88
-
89
-
90
-
91
-
92
-
93
-
94
-
95
-
96
-
97
-
98
-
99
-
100
-
101
-
102
-
103
-
104
-
105
-
106
-
107
-
108
-
109
-
110
-
111
-
112
-
113
-
114
-
115
-
116
-
117
-
118
-
119
-
120
-
121
-
122
-
123
-
124
-
125
-
126
-
127
-
128
-
129
-
130
-
131
-
132
-
133
-
134
-
135
-
136
-
137
-
138
-
139
-
140
-
141
-
142
-
143
-
144
-
145
-
146
-
147
-
148
-
149
-
150
-
151
-
 152
152 -
 153
153 -
 154
154 -
 155
155 -
 156
156 -
 157
157 -
 158
158 -
 159
159 -
 160
160 -
 161
161 -
 162
162 -
 163
163 -
 164
164 -
 165
165 -
 166
166 -
 167
167 -
 168
168 -
 169
169 -
 170
170 -
 171
171 -
 172
172 -
173
-
174
-
175
-
176
-
177
-
178
-
179
-
180
-
181
-
182
-
183
-
184
-
185
-
186
-
187
-
188
-
189
-
190
-
191
-
192
-
193
-
194
-
195
-
196
 |
 |

F82
schedules
forming part of the Consolidated Accounts (Contd.)
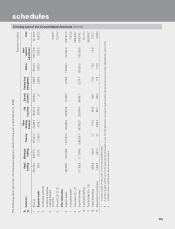
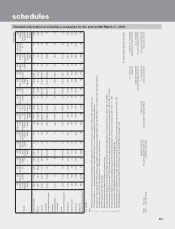
The following table sets forth, the business segment results for the year ended March 31, 2010.
Rupees in million
Sr.
no. Particulars Retail
banking Wholesale
banking Treasury Other
banking
business
Life
insurance General
insurance Venture fund
management Others Inter-
segment
adjustments Total
1. Revenue 177,244.1 192,541.3 248,297.5 34,898.1 185,378.0 28,511.1 1,832.7 32,576.6 (305,281.7) 595,997.7
2. Segment results (13,335.1) 36,451.0 27,444.4 7,733.8 2,776.5 1,583.1 744.1 6,814.2 (4,425.6) 65,786.4
3. Unallocated expenses —
4. Income tax expenses
(net)/(net deferred
tax credit) 17,352.3
5. Net profit1 (2)- (3) - (4) 48,434.1
Other information
6. Segment assets 737,339.9 1,184,314.3 1,641,699.5 610,350.8 584,434.3 65,597.7 2,532.2 183,265.0 (181,571.7) 4,827,962.0
7. Unallocated assets265,511.0
8. Total assets (6) + (7) 4,893,473.0
9. Segment liabilities 1,186,393.0 915,021.2 1,525,509.03604,992.43587,425.8366,798.532,569.53185,621.43(181,571.7) 4,892,759.1
10. Unallocated liabilities 713.9
11. Total liabilities (9) + (10) 4,893,473.0
12. Capital expenditure 1,721.0 635.8 2.9 102.6 228.3 189.7 107.5 866.5 (187.6) 3,666.7
13. Depreciation & amortisation 3,749.0 996.4 16.3 1,616.1 596.9 277.1 120.3 325.6 (69.0) 7,628.7
1. Includes share of net profit of minority shareholders.
2. Includes assets which cannot be specifically allocated to any of the segments, tax paid in advance/tax deducted at source (net), deferred tax asset (net).
3. Includes share capital and reserves and surplus.