ICICI Bank 2010 Annual Report Download - page 140
Download and view the complete annual report
Please find page 140 of the 2010 ICICI Bank annual report below. You can navigate through the pages in the report by either clicking on the pages listed below, or by using the keyword search tool below to find specific information within the annual report.-
 1
1 -
2
-
3
-
4
-
5
-
6
-
7
-
8
-
9
-
10
-
11
-
12
-
13
-
14
-
15
-
16
-
17
-
18
-
19
-
20
-
21
-
22
-
23
-
24
-
25
-
26
-
27
-
28
-
29
-
30
-
31
-
32
-
33
-
34
-
35
-
36
-
37
-
38
-
39
-
40
-
41
-
42
-
43
-
44
-
45
-
46
-
47
-
48
-
49
-
50
-
51
-
52
-
53
-
54
-
55
-
56
-
57
-
58
-
59
-
60
-
61
-
62
-
63
-
64
-
65
-
66
-
67
-
68
-
69
-
70
-
71
-
72
-
73
-
74
-
75
-
76
-
77
-
78
-
79
-
80
-
81
-
82
-
83
-
84
-
85
-
86
-
87
-
88
-
89
-
90
-
91
-
92
-
93
-
94
-
95
-
96
-
97
-
98
-
99
-
100
-
101
-
102
-
103
-
104
-
105
-
106
-
107
-
108
-
109
-
110
-
111
-
112
-
113
-
114
-
115
-
116
-
117
-
118
-
119
-
120
-
121
-
122
-
123
-
124
-
125
-
126
-
127
-
128
-
129
-
 130
130 -
 131
131 -
 132
132 -
 133
133 -
 134
134 -
 135
135 -
 136
136 -
 137
137 -
 138
138 -
 139
139 -
 140
140 -
 141
141 -
 142
142 -
 143
143 -
 144
144 -
 145
145 -
 146
146 -
 147
147 -
 148
148 -
 149
149 -
 150
150 -
151
-
152
-
153
-
154
-
155
-
156
-
157
-
158
-
159
-
160
-
161
-
162
-
163
-
164
-
165
-
166
-
167
-
168
-
169
-
170
-
171
-
172
-
173
-
174
-
175
-
176
-
177
-
178
-
179
-
180
-
181
-
182
-
183
-
184
-
185
-
186
-
187
-
188
-
189
-
190
-
191
-
192
-
193
-
194
-
195
-
196
 |
 |
F60
schedules
(Rs. in ‘000s)
forming part of the Consolidated Balance Sheet (Contd.)
At
31.03.2010 At
31.03.2009
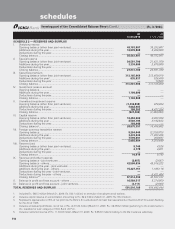
SCHEDULE 10 — FIXED ASSETS
I. Premises
At cost at March 31 of preceding year ................................................................... 29,563,202 27,235,332
Additions during the year ........................................................................................ 1,369,012 2,874,560
Deductions during the year ..................................................................................... (2,251,021) (546,690)
Depreciation to date ............................................................................................... (6,472,554) (5,485,251)
Net block1 ................................................................................................................ 22,208,639 24,077,951
II. Other fixed assets (including furniture and fixtures)
At cost at March 31 of preceding year ................................................................... 38,138,907 33,851,617
Additions during the year ........................................................................................ 2,297,683 5,496,137
Deductions during the year ..................................................................................... (4,204,505) (1,208,847)
Depreciation to date ............................................................................................... (23,351,752) (21,865,286)
Net block ................................................................................................................. 12,880,333 16,273,621
III. Assets given on Lease
At cost at March 31 of preceding year ................................................................... 17,961,174 18,289,072
Additions during the year ........................................................................................ — —
Deductions during the year ..................................................................................... (200,674) (327,898)
Depreciation to date, accumulated lease adjustment and provisions ................... (14,226,548) (13,338,157)
Net block ................................................................................................................. 3,533,952 4,623,017
TOTAL FIXED ASSETS .................................................................................................. 38,622,924 44,974,589
1. Includes assets of Rs. 446.1 million (March 31, 2009: Nil) which are in the process of being sold.
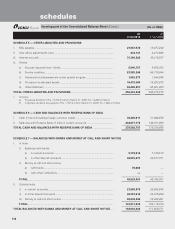
SCHEDULE 11 — OTHER ASSETS
I. Inter-office adjustments (net) .................................................................................. — —
II. Interest accrued ...................................................................................................... 41,402,059 48,793,731
III. Tax paid in advance/tax deducted at source (net) .................................................. 39,651,493 39,668,134
IV. Stationery and stamps ............................................................................................ 641 928
V. Non-banking assets acquired in satisfaction of claims1 ......................................... 743,464 3,089,212
VI. Others
a) Advance for capital assets .............................................................................. 11,907,171 9,037,902
b) Outstanding fees and other income ............................................................... 6,412,162 7,864,971
c) Deposits .......................................................................................................... 19,863,374 27,197,130
d) Deferred tax asset (net) ................................................................................... 24,842,072 25,184,000
e) Others2 ............................................................................................................ 117,607,260 128,110,533
TOTAL OTHER ASSETS ................................................................................................. 262,429,696 288,946,541
1. Includes certain non-banking assets acquired in satisfaction of claims which are in the process of being transferred in the Bank’s name.
2. Includes goodwill on consolidation amounting to Rs. 1,514.4 million (March 31, 2009: Rs. 1,573.1 million) and goodwill on purchase of
assets by way of merger amounting to Rs. 41.5 million (March 31, 2009: Rs. 119.8 million).
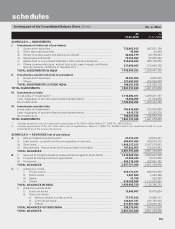
SCHEDULE 12 — CONTINGENT LIABILITIES
I. Claims against the Bank not acknowledged as debts ............................................ 35,364,093 33,911,116
II. Liability for partly paid investments ........................................................................ 128,126 128,126
III. Liability on account of outstanding forward exchange contracts .......................... 1,753,368,882 2,520,288,201
IV. Guarantees given on behalf of constituents ...........................................................
a) In India 489,303,787 453,001,349
b) Outside India ................................................................................................... 129,981,831 129,161,843
V. Acceptances, endorsements and other obligations ............................................... 321,795,858 307,424,746
VI. Currency swaps ...................................................................................................... 506,938,754 551,306,568
VII. Interest rate swaps, currency options and interest rate futures ............................ 4,846,442,184 4,555,533,888
VIII. Other items for which the Bank is contingently liable ............................................ 121,875,833 127,128,197
TOTAL CONTINGENT LIABILITIES ............................................................................... 8,205,199,348 8,677,884,034