ICICI Bank 2010 Annual Report Download - page 119
Download and view the complete annual report
Please find page 119 of the 2010 ICICI Bank annual report below. You can navigate through the pages in the report by either clicking on the pages listed below, or by using the keyword search tool below to find specific information within the annual report.-
 1
1 -
2
-
3
-
4
-
5
-
6
-
7
-
8
-
9
-
10
-
11
-
12
-
13
-
14
-
15
-
16
-
17
-
18
-
19
-
20
-
21
-
22
-
23
-
24
-
25
-
26
-
27
-
28
-
29
-
30
-
31
-
32
-
33
-
34
-
35
-
36
-
37
-
38
-
39
-
40
-
41
-
42
-
43
-
44
-
45
-
46
-
47
-
48
-
49
-
50
-
51
-
52
-
53
-
54
-
55
-
56
-
57
-
58
-
59
-
60
-
61
-
62
-
63
-
64
-
65
-
66
-
67
-
68
-
69
-
70
-
71
-
72
-
73
-
74
-
75
-
76
-
77
-
78
-
79
-
80
-
81
-
82
-
83
-
84
-
85
-
86
-
87
-
88
-
89
-
90
-
91
-
92
-
93
-
94
-
95
-
96
-
97
-
98
-
99
-
100
-
101
-
102
-
103
-
104
-
105
-
106
-
107
-
108
-
 109
109 -
 110
110 -
 111
111 -
 112
112 -
 113
113 -
 114
114 -
 115
115 -
 116
116 -
 117
117 -
 118
118 -
 119
119 -
 120
120 -
 121
121 -
 122
122 -
 123
123 -
 124
124 -
 125
125 -
 126
126 -
 127
127 -
 128
128 -
 129
129 -
130
-
131
-
132
-
133
-
134
-
135
-
136
-
137
-
138
-
139
-
140
-
141
-
142
-
143
-
144
-
145
-
146
-
147
-
148
-
149
-
150
-
151
-
152
-
153
-
154
-
155
-
156
-
157
-
158
-
159
-
160
-
161
-
162
-
163
-
164
-
165
-
166
-
167
-
168
-
169
-
170
-
171
-
172
-
173
-
174
-
175
-
176
-
177
-
178
-
179
-
180
-
181
-
182
-
183
-
184
-
185
-
186
-
187
-
188
-
189
-
190
-
191
-
192
-
193
-
194
-
195
-
196
 |
 |

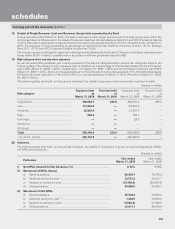
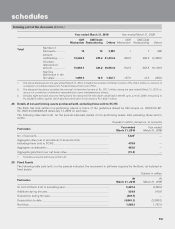
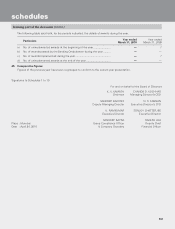
F39
Year ended March 31, 2010 Year ended March 31, 2009
CDR
Mechanism SME Debt
Restructuring Others CDR
Mechanism SME Debt
Restructuring Others
Total Number of
Borrowers ............. 14 12 3,907 1 7 988
Amount
outstanding .......... 14,826.8 475.4 41,414.2 928.0 406.4 13,496.2
Of which:
restructured
amount ................. 13,068.7 329.2 39,681.0 912.2 263.9 10,130.9
Sacrifice
(diminution in the
fair value) .............. 1,086.6 10.8 1,432.7 107.0 12.2 208.0
1. The above disclosure for the year ended March 31, 2010, includes the reversal of interest income of Rs. 704.3 million on account of
conversion of overdue interest into Funded Interest Term Loan (FITL).
2. The aforesaid disclosure excludes the reversal of derivative income of Rs. 303.1 million during the year ended March 31, 2010 on
account of conversion of derivative receivables into term loan/preference shares.
3. Includes eight borrowal accounts restructured for a second time with asset classification benefit upto June 30, 2009, amounting to
Rs. 24,280.8 million against which sacrifice (diminution in fair value) is Rs.1,498.1 million.
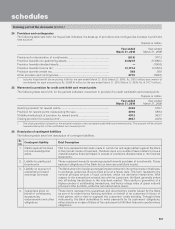
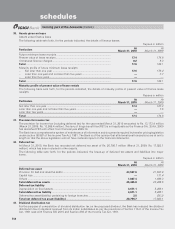
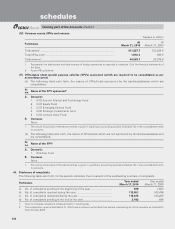
28. Details of non-performing assets purchased/sold, excluding those sold to SC/RC
The Bank has sold certain non-performing assets in terms of the guidelines issued by RBI circular no. DBOD.No.BP.
BC.16/21.04.048/2005-06 dated July 13, 2005 on such sale.
The following table sets forth, for the periods indicated, details of non-performing assets sold, excluding those sold to
SC/RC.
Rupees in million, except no. of accounts
Particulars Year ended
March 31, 2010
Year ended
March 31, 2009
No. of accounts ................................................................................................... 7,4281—
Aggregate value (net of provisions) of accounts sold,
excluding those sold to SC/RC ........................................................................... 479.0 —
Aggregate consideration ..................................................................................... 463.6 —
Aggregate gain/(loss) over net book value ......................................................... (15.4) —
1. Excludes accounts previously written off.
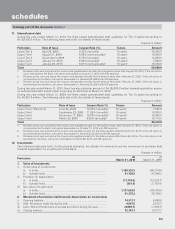
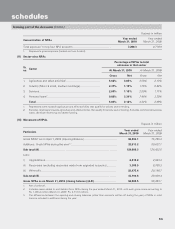
29. Fixed Assets
The following table sets forth, for the periods indicated, the movement in software acquired by the Bank, as included in
fixed assets.
Rupees in million
Particulars At
March 31, 2010
At
March 31, 2009
At cost at March 31st of preceding year ............................................................ 5,267.4 4,448.8
Additions during the year .................................................................................... 824.9 818.6
Deductions during the year................................................................................. (239.7) —
Depreciation to date ........................................................................................... (4,043.3) (3,509.5)
Net block ............................................................................................................. 1,809.3 1,757.9
schedules
forming part of the Accounts (Contd.)