ICICI Bank 2010 Annual Report Download - page 89
Download and view the complete annual report
Please find page 89 of the 2010 ICICI Bank annual report below. You can navigate through the pages in the report by either clicking on the pages listed below, or by using the keyword search tool below to find specific information within the annual report.-
 1
1 -
2
-
3
-
4
-
5
-
6
-
7
-
8
-
9
-
10
-
11
-
12
-
13
-
14
-
15
-
16
-
17
-
18
-
19
-
20
-
21
-
22
-
23
-
24
-
25
-
26
-
27
-
28
-
29
-
30
-
31
-
32
-
33
-
34
-
35
-
36
-
37
-
38
-
39
-
40
-
41
-
42
-
43
-
44
-
45
-
46
-
47
-
48
-
49
-
50
-
51
-
52
-
53
-
54
-
55
-
56
-
57
-
58
-
59
-
60
-
61
-
62
-
63
-
64
-
65
-
66
-
67
-
68
-
69
-
70
-
71
-
72
-
73
-
74
-
75
-
76
-
77
-
78
-
 79
79 -
 80
80 -
 81
81 -
 82
82 -
 83
83 -
 84
84 -
 85
85 -
 86
86 -
 87
87 -
 88
88 -
 89
89 -
 90
90 -
 91
91 -
 92
92 -
 93
93 -
 94
94 -
 95
95 -
 96
96 -
 97
97 -
 98
98 -
 99
99 -
100
-
101
-
102
-
103
-
104
-
105
-
106
-
107
-
108
-
109
-
110
-
111
-
112
-
113
-
114
-
115
-
116
-
117
-
118
-
119
-
120
-
121
-
122
-
123
-
124
-
125
-
126
-
127
-
128
-
129
-
130
-
131
-
132
-
133
-
134
-
135
-
136
-
137
-
138
-
139
-
140
-
141
-
142
-
143
-
144
-
145
-
146
-
147
-
148
-
149
-
150
-
151
-
152
-
153
-
154
-
155
-
156
-
157
-
158
-
159
-
160
-
161
-
162
-
163
-
164
-
165
-
166
-
167
-
168
-
169
-
170
-
171
-
172
-
173
-
174
-
175
-
176
-
177
-
178
-
179
-
180
-
181
-
182
-
183
-
184
-
185
-
186
-
187
-
188
-
189
-
190
-
191
-
192
-
193
-
194
-
195
-
196
 |
 |

F9
schedules
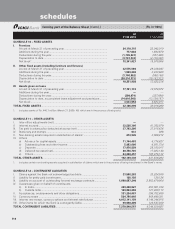
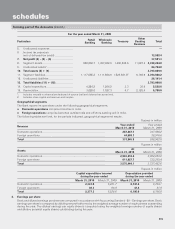
forming part of the Balance Sheet (Contd.) (Rs. in ‘000s)
At
31.03.2010 At
31.03.2009
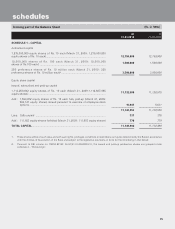
SCHEDULE 8 – INVESTMENTS
I. Investments in India [net of provisions]
i) Government securities ............................................................................. 683,991,406 633,774,902
ii) Other approved securities........................................................................ 45,009 93,405
iii) Shares (includes equity and preference shares) ...................................... 27,557,381 17,031,332
iv) Debentures and bonds ............................................................................ 36,353,907 26,000,683
v) Subsidiaries and/or joint ventures1 .......................................................... 62,226,766 61,194,621
vi) Others (commercial paper, mutual fund units, pass through certificates,
security receipts, certificate of deposits etc.) ........................................ 307,378,383 196,688,823
TOTAL INVESTMENTS IN INDIA ........................................................................... 1,117,552,852 934,783,766
II. Investments outside India [net of provisions]
i) Government securities ............................................................................. 1,645,046 953,347
ii) Subsidiaries and/or joint ventures abroad (includes equity and preference
shares) ...................................................................................................... 66,005,026 65,924,016
iii) Others ....................................................................................................... 23,725,081 28,921,951
TOTAL INVESTMENTS OUTSIDE INDIA ............................................................... 91,375,153 95,799,314
TOTAL INVESTMENTS ........................................................................................... 1,208,928,005 1,030,583,080
III. Investments in India
Gross value of investments ............................................................................. 1,129,332,338 947,314,476
Less: Aggregate of provision/depreciation ..................................................... 11,779,486 12,530,710
Net investments ............................................................................................... 1,117,552,852 934,783,766
IV. Investments outside India
Gross value of investments ............................................................................. 91,756,742 97,586,277
Less: Aggregate of provision/depreciation ..................................................... 381,589 1,786,963
Net investments ............................................................................................... 91,375,153 95,799,314
TOTAL INVESTMENTS ........................................................................................... 1,208,928,005 1,030,583,080
1. Includes application money of Rs. 1,000.0 million (March 31, 2009: Nil).
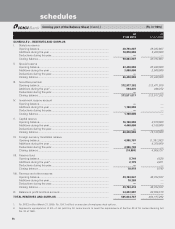
SCHEDULE 9 - ADVANCES [net of provisions]
A i) Bills purchased and discounted ............................................................... 44,531,591 40,610,992
ii) Cash credits, overdrafts and loans repayable on demand ...................... 255,552,276 343,945,509
iii) Term loans................................................................................................ 1,404,149,152 1,696,347,568
iv) Securitisation, finance lease and hire purchase receivables ................... 107,822,952 102,204,423
TOTAL ADVANCES ................................................................................................. 1,812,055,971 2,183,108,492
B. i) Secured by tangible assets (includes advances against book debts) ..... 1,336,426,827 1,575,653,288
ii) Covered by bank/government guarantees ............................................... 21,202,426 14,815,009
iii) Unsecured ................................................................................................ 454,426,718 592,640,195
TOTAL ADVANCES ................................................................................................. 1,812,055,971 2,183,108,492
C. I. Advances in India
i) Priority sector ................................................................................... 539,773,871 620,515,976
ii) Public sector ..................................................................................... 3,201,088 3,494,486
iii) Banks ................................................................................................ 41,790 252,580
iv) Others ............................................................................................... 817,672,519 1,015,930,993
TOTAL ADVANCES IN INDIA ................................................................................. 1,360,689,268 1,640,194,035
II. Advances outside India
i) Due from banks ................................................................................ 13,515,963 14,965,907
ii) Due from others
a) Bills purchased and discounted ............................................... 15,060,877 13,856,733
b) Commercial loans..................................................................... 206,115,152 283,420,282
c) Others ....................................................................................... 216,674,711 230,671,535
TOTAL ADVANCES OUTSIDE INDIA ..................................................................... 451,366,703 542,914,457
TOTAL ADVANCES ................................................................................................. 1,812,055,971 2,183,108,492