ICICI Bank 2010 Annual Report Download - page 107
Download and view the complete annual report
Please find page 107 of the 2010 ICICI Bank annual report below. You can navigate through the pages in the report by either clicking on the pages listed below, or by using the keyword search tool below to find specific information within the annual report.-
 1
1 -
2
-
3
-
4
-
5
-
6
-
7
-
8
-
9
-
10
-
11
-
12
-
13
-
14
-
15
-
16
-
17
-
18
-
19
-
20
-
21
-
22
-
23
-
24
-
25
-
26
-
27
-
28
-
29
-
30
-
31
-
32
-
33
-
34
-
35
-
36
-
37
-
38
-
39
-
40
-
41
-
42
-
43
-
44
-
45
-
46
-
47
-
48
-
49
-
50
-
51
-
52
-
53
-
54
-
55
-
56
-
57
-
58
-
59
-
60
-
61
-
62
-
63
-
64
-
65
-
66
-
67
-
68
-
69
-
70
-
71
-
72
-
73
-
74
-
75
-
76
-
77
-
78
-
79
-
80
-
81
-
82
-
83
-
84
-
85
-
86
-
87
-
88
-
89
-
90
-
91
-
92
-
93
-
94
-
95
-
96
-
 97
97 -
 98
98 -
 99
99 -
 100
100 -
 101
101 -
 102
102 -
 103
103 -
 104
104 -
 105
105 -
 106
106 -
 107
107 -
 108
108 -
 109
109 -
 110
110 -
 111
111 -
 112
112 -
 113
113 -
 114
114 -
 115
115 -
 116
116 -
 117
117 -
118
-
119
-
120
-
121
-
122
-
123
-
124
-
125
-
126
-
127
-
128
-
129
-
130
-
131
-
132
-
133
-
134
-
135
-
136
-
137
-
138
-
139
-
140
-
141
-
142
-
143
-
144
-
145
-
146
-
147
-
148
-
149
-
150
-
151
-
152
-
153
-
154
-
155
-
156
-
157
-
158
-
159
-
160
-
161
-
162
-
163
-
164
-
165
-
166
-
167
-
168
-
169
-
170
-
171
-
172
-
173
-
174
-
175
-
176
-
177
-
178
-
179
-
180
-
181
-
182
-
183
-
184
-
185
-
186
-
187
-
188
-
189
-
190
-
191
-
192
-
193
-
194
-
195
-
196
 |
 |

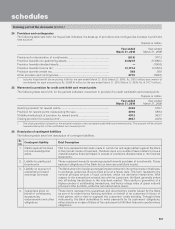
F27
Rupees in million
At
March 31, 2010 At
March 31, 2009
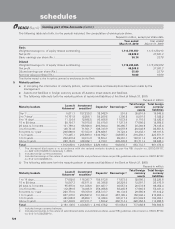
Outstanding credit enhancement (funded) ................................................... 9,987.3 13,086.1
Outstanding liquidity facility ......................................................................... 3,196.9 6,853.4
Net outstanding servicing asset/(liability) ..................................................... 225.7 748.9
Outstanding subordinate contributions ........................................................ 7,424.3 8,849.0
The outstanding credit enhancement in the form of guarantees amounted to Rs. 19,920.0 million at March 31, 2010 (March
31, 2009: Rs. 27,732.9 million).
Outstanding credit enhancement in the form of guarantees for third party originated securitisation transactions amounted
to Rs. 6,442.0 at March 31, 2010 (March 31, 2009: Rs. 6,520.5) and outstanding liquidity facility for third party originated
securitisation transactions amounted to Rs. 0.2 million at March 31, 2010 (March 31, 2009: Rs. 4.0 million).
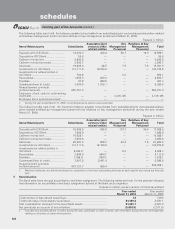
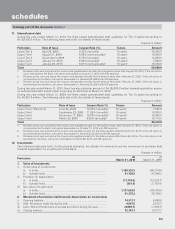
The following table sets forth, for the periods indicated, the details of provision created at the time of securitisation.
Rupees in million
Particulars Year ended
March 31, 2010 Year ended
March 31, 2009
Opening balance ........................................................................................... 5,567.2 9,186.7
Add: Additions during the period ................................................................. 1,038.4 630.5
Less: Deductions during the period ............................................................. 4,351.8 4,250.0
Closing balance ............................................................................................. 2,253.8 5,567.2
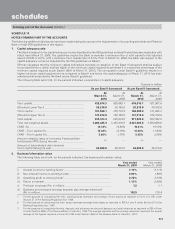
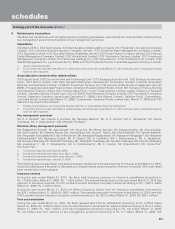
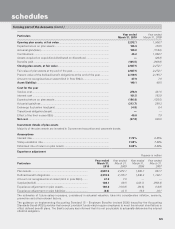
8. Staff retirement benefits
Pension
The following tables set forth, for the periods indicated, reconciliation of opening and closing balance of the present value
of the defined benefit obligation for pension benefits.
Rupees in million
Particulars Year ended
March 31, 2010 Year ended
March 31, 2009
Opening obligations .......................................................................................... 1,932.2 1,678.1
Service cost ......................................................................................................... 51.8 62.5
Interest cost ........................................................................................................ 134.5 146.6
Actuarial (gain)/loss ............................................................................................. (32.1) 484.8
Liabilities extinguished on settlement ................................................................ (287.7) (364.2)
Benefits paid ....................................................................................................... (50.0) (75.6)
Obligations at end of year ................................................................................ 1,748.7 1,932.2
Opening plan assets, at fair value .................................................................... 2,145.3 1,490.1
Expected return on plan assets .......................................................................... 169.9 117.4
Actuarial gain/(loss) ............................................................................................. (130.7) 144.8
Assets distributed on settlement ....................................................................... (322.6) (395.8)
Contributions ....................................................................................................... 28.0 864.4
Benefits paid ....................................................................................................... (50.0) (75.6)
Closing plan assets, at fair value ...................................................................... 1,839.9 2,145.3
Fair value of plan assets at the end of the year .................................................. 1,839.9 2,145.3
Present value of the defined benefit obligations at the end of the year ............ 1,748.7 1,932.2
Amount not recognised as an asset (limit in Para 59(b)) .................................... 7.7 51.2
Asset/(liability)................................................................................................... 83.5 161.9
schedules
forming part of the Accounts (Contd.)