ICICI Bank 2010 Annual Report Download - page 114
Download and view the complete annual report
Please find page 114 of the 2010 ICICI Bank annual report below. You can navigate through the pages in the report by either clicking on the pages listed below, or by using the keyword search tool below to find specific information within the annual report.-
 1
1 -
2
-
3
-
4
-
5
-
6
-
7
-
8
-
9
-
10
-
11
-
12
-
13
-
14
-
15
-
16
-
17
-
18
-
19
-
20
-
21
-
22
-
23
-
24
-
25
-
26
-
27
-
28
-
29
-
30
-
31
-
32
-
33
-
34
-
35
-
36
-
37
-
38
-
39
-
40
-
41
-
42
-
43
-
44
-
45
-
46
-
47
-
48
-
49
-
50
-
51
-
52
-
53
-
54
-
55
-
56
-
57
-
58
-
59
-
60
-
61
-
62
-
63
-
64
-
65
-
66
-
67
-
68
-
69
-
70
-
71
-
72
-
73
-
74
-
75
-
76
-
77
-
78
-
79
-
80
-
81
-
82
-
83
-
84
-
85
-
86
-
87
-
88
-
89
-
90
-
91
-
92
-
93
-
94
-
95
-
96
-
97
-
98
-
99
-
100
-
101
-
102
-
103
-
 104
104 -
 105
105 -
 106
106 -
 107
107 -
 108
108 -
 109
109 -
 110
110 -
 111
111 -
 112
112 -
 113
113 -
 114
114 -
 115
115 -
 116
116 -
 117
117 -
 118
118 -
 119
119 -
 120
120 -
 121
121 -
 122
122 -
 123
123 -
 124
124 -
125
-
126
-
127
-
128
-
129
-
130
-
131
-
132
-
133
-
134
-
135
-
136
-
137
-
138
-
139
-
140
-
141
-
142
-
143
-
144
-
145
-
146
-
147
-
148
-
149
-
150
-
151
-
152
-
153
-
154
-
155
-
156
-
157
-
158
-
159
-
160
-
161
-
162
-
163
-
164
-
165
-
166
-
167
-
168
-
169
-
170
-
171
-
172
-
173
-
174
-
175
-
176
-
177
-
178
-
179
-
180
-
181
-
182
-
183
-
184
-
185
-
186
-
187
-
188
-
189
-
190
-
191
-
192
-
193
-
194
-
195
-
196
 |
 |

F34
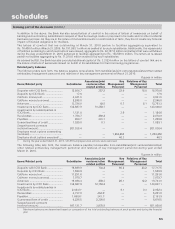
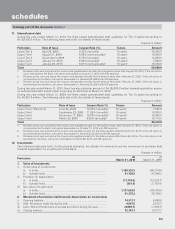
The following table sets forth, for the periods indicated, the position of lending to capital market sector.
Rupees in million
At
March 31, 2010 At
March 31, 2009
Capital market sector
i) Direct investment in equity shares, convertible debentures and units of
equity-oriented mutual funds, the corpus of which is not exclusively invested
in corporate debt .......................................................................................... 22,082.3 13,167.9
ii) Advances against shares/bonds/debentures or other securities or on
clean basis to individuals for investment in shares (including IPOs/ESOPs),
convertible bonds, convertible debentures, and units of equity-oriented
mutual funds ................................................................................................ 34,463.6 7,408.5
iii) Advances for any other purposes where shares or convertible bonds or
convertible debentures or units of equity oriented mutual funds are taken
as primary security ...................................................................................... 5,315.6 271.7
iv) Advances for any other purposes to the extent secured by the collateral
security of shares or convertible bonds or convertible debentures or units
of equity oriented mutual funds .................................................................. 330.6 609.7
v) Secured and unsecured advances to stockbrokers and guarantees issued
on behalf of stockbrokers and market makers ........................................... 22,771.3 22,890.5
vi) Loans sanctioned to corporate against the security of shares/bonds/
debentures or other securities or on clean basis for meeting promoter’s
contribution to the equity of new companies in anticipation of raising
resources ..................................................................................................... ——
vii) Bridge loans to companies against expected equity flows/issues ............. ——
viii) Underwriting commitments taken up by the Bank in respect of primary issue
of shares or convertible bonds or convertible debentures or units of equity
oriented mutual funds .................................................................................. ——
ix) Financing to stockbrokers for margin trading ............................................. ——
x) All exposures to Venture Capital Funds (both registered and unregistered) 12,214.3 13,564.3
xi) Others .......................................................................................................... 14,091.8 3,922.2
Total Exposure to Capital Market ............................................................. 111,269.5 61,834.8
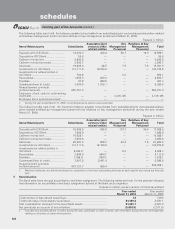
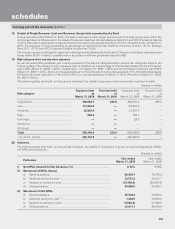
The following table sets forth, for the periods indicated, the summary of lending to real estate sector.
Rupees in million
At
March 31, 2010 At
March 31, 2009
Real estate sector
I. Direct exposure .............................................................................................. 579,950.5 697,579.8
i) Residential mortgages ............................................................................
of which: individual housing loans eligible for priority sector advances 434,865.1
205,019.4 545,263.3
266,820.6
ii) Commercial real estate1 .......................................................................... 135,198.6 142,441.7
iii) Investments in mortgage backed securities (MBS) and other
securitised exposure ............................................................................... 9,886.8 9,874.8
a. Residential ....................................................................................... 9,886.8 9,874.8
b. Commercial real estate ................................................................... ——
II. Indirect exposure ........................................................................................... 58,756.8 70,441.1
i) Fund based and non-fund based exposures on National Housing Bank
(NHB) and Housing Finance Companies (HFCs) ..................................... 58,104.1 66,477.4
ii) Others ..................................................................................................... 652.7 3,963.7
Total Exposure to Real Estate Sector2 ......................................................... 638,707.3 768,020.9
1. Commercial real estate exposure include loans to individuals against non-residential premises, loans given to land and building
developers for construction, corporate loans for development of special economic zone, loans to borrowers where servicing of loans
is from a real estate activity and exposures to mutual funds/venture capital funds/private equity funds investing primarily in the real
estate companies.
2. Excludes non-banking assets acquired in satisfaction of claims.
schedules
forming part of the Accounts (Contd.)