ICICI Bank 2010 Annual Report Download - page 134
Download and view the complete annual report
Please find page 134 of the 2010 ICICI Bank annual report below. You can navigate through the pages in the report by either clicking on the pages listed below, or by using the keyword search tool below to find specific information within the annual report.-
 1
1 -
2
-
3
-
4
-
5
-
6
-
7
-
8
-
9
-
10
-
11
-
12
-
13
-
14
-
15
-
16
-
17
-
18
-
19
-
20
-
21
-
22
-
23
-
24
-
25
-
26
-
27
-
28
-
29
-
30
-
31
-
32
-
33
-
34
-
35
-
36
-
37
-
38
-
39
-
40
-
41
-
42
-
43
-
44
-
45
-
46
-
47
-
48
-
49
-
50
-
51
-
52
-
53
-
54
-
55
-
56
-
57
-
58
-
59
-
60
-
61
-
62
-
63
-
64
-
65
-
66
-
67
-
68
-
69
-
70
-
71
-
72
-
73
-
74
-
75
-
76
-
77
-
78
-
79
-
80
-
81
-
82
-
83
-
84
-
85
-
86
-
87
-
88
-
89
-
90
-
91
-
92
-
93
-
94
-
95
-
96
-
97
-
98
-
99
-
100
-
101
-
102
-
103
-
104
-
105
-
106
-
107
-
108
-
109
-
110
-
111
-
112
-
113
-
114
-
115
-
116
-
117
-
118
-
119
-
120
-
121
-
122
-
123
-
 124
124 -
 125
125 -
 126
126 -
 127
127 -
 128
128 -
 129
129 -
 130
130 -
 131
131 -
 132
132 -
 133
133 -
 134
134 -
 135
135 -
 136
136 -
 137
137 -
 138
138 -
 139
139 -
 140
140 -
 141
141 -
 142
142 -
 143
143 -
 144
144 -
145
-
146
-
147
-
148
-
149
-
150
-
151
-
152
-
153
-
154
-
155
-
156
-
157
-
158
-
159
-
160
-
161
-
162
-
163
-
164
-
165
-
166
-
167
-
168
-
169
-
170
-
171
-
172
-
173
-
174
-
175
-
176
-
177
-
178
-
179
-
180
-
181
-
182
-
183
-
184
-
185
-
186
-
187
-
188
-
189
-
190
-
191
-
192
-
193
-
194
-
195
-
196
 |
 |

F54
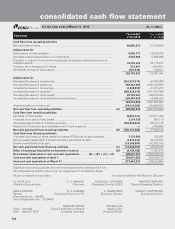
consolidated cash flow statement
for the year ended March 31, 2010
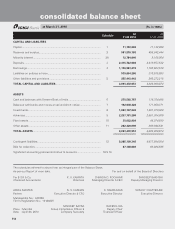
Significant accounting policies and notes to accounts (refer schedule 18 & 19).
The schedules referred to above form an integral part of the Balance Sheet.
As per our Report of even date. For and on behalf of the Board of Directors
For B S R & Co. K. V. KAMATH CHANDA D. KOCHHAR SANDEEP BAKHSHI
Chartered Accountants Chairman Managing Director & CEO Deputy Managing Director
AKEEL MASTER N. S. KANNAN K. RAMKUMAR SONJOY CHATTERJEE
Partner Executive Director & CFO Executive Director Executive Director
Membership No.: 046768
Firm’s Registration No.: 101248W
SANDEEP BATRA RAKESH JHA
Place : Mumbai Group Compliance Officer & Deputy Chief
Date : April 24, 2010 Company Secretary Financial Officer
(Rs. in ‘000s)
Particulars Year ended
31.03.2010 Year ended
31.03.2009
Cash flow from operating activities
Net profit before taxes
.................................................................................................... 64,055,237 51,658,808
Adjustments for:
Depreciation and amortisation ........................................................................................ 9,085,111 10,034,785
Net (appreciation)/depreciation on investments............................................................. 4,526,200 17,990,288
Provision in respect of non-performing assets (including prudential provision on
standard assets) .............................................................................................................. 44,745,424 39,115,672
Provision for contingencies & others .............................................................................. 513,461 (303,901)
(Profit)/loss on sale of fixed assets ................................................................................. (821,610) (14,611)
122,103,823 118,481,041
Adjustments for:
(Increase)/decrease in investments ................................................................................ (216,921,819) (4,416,202)
(Increase)/decrease in advances ..................................................................................... 358,364,395 (185,733,697)
Increase/(decrease) in borrowings .................................................................................. (3,820,938) 41,331,233
Increase/(decrease) in deposits ...................................................................................... (202,834,572) (151,274,780)
(Increase)/decrease in other assets ................................................................................ 28,724,367 (39,234,654)
Increase/(decrease) in other liabilities and provisions .................................................... 229,307,649 16,998,654
192,819,082 (322,329,446)
(Payment)/refund of taxes (net) ....................................................................................... (19,414,369) (18,405,479)
Net cash flow from operating activities ...................................................................... (A) 295,508,536 (222,253,884)
Cash flow from investing activities
Purchase of fixed assets ................................................................................................. (6,654,131) (13,071,158)
Proceeds from sale of fixed assets ................................................................................ 3,374,730 897,114
(Purchase)/sale of held to maturity securities ................................................................ (152,852,224) 90,016,170
Acquisition of business by a subsidiary (net of cash acquired) ..................................... — (140,002)
Net cash generated from investing activities ............................................................. (B) (156,131,625) 77,702,124
Cash flow from financing activities
Proceeds from issue of share capital (including ESOPs) net of issue expense ............. 1,175,994 522,062
Net proceeds/(repayment) of bonds (including subordinated debt) .............................. (1,247,434) 44,144,641
Dividend and dividend tax paid ....................................................................................... (14,348,954) (14,229,374)
Net cash generated from financing activities.............................................................. (C) (14,420,394) 30,437,329
Effect of exchange fluctuation on translation reserve ................................................ (D) (4,129,160) 11,441,514
Net increase/(decrease) in cash and cash equivalents .............(A) + (B) + (C) + (D) 120,827,357 (102,672,917)
Cash and cash equivalents at April 1 ........................................................................... 350,613,856 453,286,773
Cash and cash equivalents at March 31 ...................................................................... 471,441,213 350,613,856