Vodafone 2014 Annual Report Download - page 99
Download and view the complete annual report
Please find page 99 of the 2014 Vodafone annual report below. You can navigate through the pages in the report by either clicking on the pages listed below, or by using the keyword search tool below to find specific information within the annual report.-
 1
1 -
2
-
3
-
4
-
5
-
6
-
7
-
8
-
9
-
10
-
11
-
12
-
13
-
14
-
15
-
16
-
17
-
18
-
19
-
20
-
21
-
22
-
23
-
24
-
25
-
26
-
27
-
28
-
29
-
30
-
31
-
32
-
33
-
34
-
35
-
36
-
37
-
38
-
39
-
40
-
41
-
42
-
43
-
44
-
45
-
46
-
47
-
48
-
49
-
50
-
51
-
52
-
53
-
54
-
55
-
56
-
57
-
58
-
59
-
60
-
61
-
62
-
63
-
64
-
65
-
66
-
67
-
68
-
69
-
70
-
71
-
72
-
73
-
74
-
75
-
76
-
77
-
78
-
79
-
80
-
81
-
82
-
83
-
84
-
85
-
86
-
87
-
88
-
 89
89 -
 90
90 -
 91
91 -
 92
92 -
 93
93 -
 94
94 -
 95
95 -
 96
96 -
 97
97 -
 98
98 -
 99
99 -
 100
100 -
 101
101 -
 102
102 -
 103
103 -
 104
104 -
 105
105 -
 106
106 -
 107
107 -
 108
108 -
 109
109 -
110
-
111
-
112
-
113
-
114
-
115
-
116
-
117
-
118
-
119
-
120
-
121
-
122
-
123
-
124
-
125
-
126
-
127
-
128
-
129
-
130
-
131
-
132
-
133
-
134
-
135
-
136
-
137
-
138
-
139
-
140
-
141
-
142
-
143
-
144
-
145
-
146
-
147
-
148
-
149
-
150
-
151
-
152
-
153
-
154
-
155
-
156
-
157
-
158
-
159
-
160
-
161
-
162
-
163
-
164
-
165
-
166
-
167
-
168
-
169
-
170
-
171
-
172
-
173
-
174
-
175
-
176
-
177
-
178
-
179
-
180
-
181
-
182
-
183
-
184
-
185
-
186
-
187
-
188
-
189
-
190
-
191
-
192
-
193
-
194
-
195
-
196
-
197
-
198
-
199
-
200
-
201
-
202
-
203
-
204
-
205
-
206
-
207
-
208
-
209
-
210
-
211
-
212
-
213
-
214
-
215
-
216
 |
 |

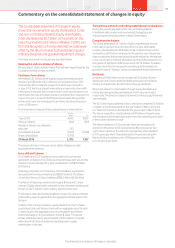
Commentary on the consolidated income statement
and statement of comprehensive income
The consolidated income statement includes the
majority of our income and expenses for the year
with the remainder recorded in the consolidated
statement of comprehensive income.
Further details on the major movements in the year are set out below:
Revenue
Revenue increased by 0.8% to £38.3 billion. The increase is driven
by revenue growth in our AMAP region and business acquisitions,
partially offset by revenue declines in Europe due to challenging
trading conditions and by unfavourable exchange rate movements.
Our operating results discussion on pages 40 to 45 provides further
detail on our revenue performance.
Operating loss
Our operating loss increased to £3.9 billion from £2.2 billion as lower
impairment charges were offset by lower revenue, higher customer
costs and higher amortisation. During the year we recorded goodwill
impairment charges of £6.6 billion relating to our businesses
in Germany, Spain, Portugal, Czech Republic and Romania (see note 4
“Impairment losses”).
Income tax expense
We recorded an income tax credit on continuing operations
of £16.6 billion compared with a £0.5 billion charge in 2013. The credit
primarily arises from the recognition of £19.3 billion of deferred
tax assets for tax losses in Germany and Luxembourg partly offset
by taxes arising from the disposal of the Group’s investment in Verizon
Wireless (see note 6 “Taxation”). Our adjusted effective tax rate,
a non-GAAP measure used by management to measure the rate
of tax on our adjusted prot before tax, increased to 27.3% from
24.5%. Further information on how our adjusted effective tax charge
is determined is provided within the operating results discussion
on page 44.
Prot for the year from discontinued operations
Discontinued operations includes the £45.0 billion prot arising on the
disposal of the Group’s investment in Verizon Wireless, £1.7 billion
of dividends receivable since the disposal and the post-tax prots
of the Group’s share of Verizon Wireless and entities in the US Group
sold to Verizon Communications as part of the overall disposal
transaction up until 2 September 2013 when the proposed disposal was
announced. The prot from discontinued operations for the year ended
31 March 2014 has increased to £48.1 billion from £4.6 billion, primarily
due to the prot arising from the disposal of the Group’s investment
in Verizon Wireless. Further information is provided in note 7
“Discontinued operations” and note 28 “Acquisitions and disposals”.
Earnings per share
Basic earnings per share from continuing operations was 42.10 pence,
an increase of 57.76 pence, driven by the recognition of £19.3 billion
of deferred tax assets for losses in Germany and Luxembourg.
Total Group basic earnings per share, which includes prots from
discontinued operations, increased by 222.30 pence to 223.84 pence
primarily as a result of the £45.0 billion gain recognised on the disposal
of the US Group.
Adjusted earnings per share, which is a non-GAAP measure used
by management and which excludes items that we do not view as being
reective of our performance, was 17.54 pence, a decrease of 12.8%
compared to the prior year. The reduction was primarily due to lower
adjusted operating prots, partially offset by a reduction in the number
of the Group’s shares due to the Group’s share buyback programme.
Our calculation of the adjusted earnings on which we base our adjusted
earnings per share calculation is set out within the operating results
on page 45. Note 8 “Earnings per share” provides information on the
number of shares used for determining earnings per share.
The consolidated statement of comprehensive
income records all of the income and
losses generated for the year.
Further details on the major movements in the year are set out below:
Prot for the nancial year
Prot for the nancial year of £59.4 billion is recognised in the
consolidated income statement and the reasons underlying the
£58.8 billion increase are provided above.
Foreign exchange differences, net of tax
Foreign exchange translation differences arise when we translate the
results and net assets of our operating companies, joint arrangements
and associates, which transact their operations in foreign currencies
including the euro, South African rand and Indian rupee, into our
presentation currency of sterling. The net movements in foreign
exchange rates resulted in a loss of £4.1 billion for the year compared
with a gain in the previous year of £0.4 billion.
Foreign exchange losses/(gains) transferred to the
income statement
The foreign exchange losses transferred to the income statement
in the year ended 31 March 2014 relate to the recycling of amounts
in relation to our investment in Verizon Wireless and Vodafone Italy
which were triggered, respectively, by the disposal and the acquisition
of a controlling stake.
Net actuarial gains/(losses) on dened benet schemes,
net of tax
We realised a £37 million post-tax gain from the revaluation of the
Group’s dened benet pension schemes after updating actuarial
assumptions and revaluing scheme assets.
The nancial commentary on this page is unaudited.
Vodafone Group Plc
96 97Overview Strategy
review Performance Governance Financials
Additional
information