Vodafone 2014 Annual Report Download - page 142
Download and view the complete annual report
Please find page 142 of the 2014 Vodafone annual report below. You can navigate through the pages in the report by either clicking on the pages listed below, or by using the keyword search tool below to find specific information within the annual report.
21. Borrowings (continued)
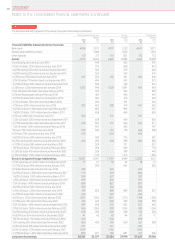
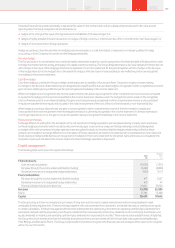
The fair value and carrying value of the Group’s long-term borrowings is as follows:
Sterling equivalent nominal value Fair value Carrying value
2014
Restated
2013 2014
Restated
2013 2014
Restated
2013
£m £m £m £m £m £m
Financial liabilities measured at amortised cost:
Bank loans 4,788 3,017 4,707 3,122 4,647 3,077
Redeemable preference shares –1,086 –1,020 – 1,355
Other liabilities 110 731 110 821 110 753
Bonds: 4,272 14,456 4,620 15,986 4,465 15,698
Euro oating rate note due June 2014 –949 –952 –951
4.15% US dollar 1,250 million bond due June 2014 –795 –828 –810
4.625% sterling 350 million bond due September 2014 –304 –319 –320
4.625% sterling 525 million bond due September 2014 –525 –552 –541
5.125% euro 500 million bond due April 2015 413 422 432 461 435 446
5.0% US dollar 750 million bond due September 2015 –494 –543 –521
3.375% US dollar 500 million bond due November 2015 –329 –349 –331
6.25% euro 1,250 million bond due January 2016 1,032 949 1,020 1,091 943 964
0.9% US dollar 900 million bond due February 2016 –592 –592 –592
US dollar oating rate note due February 2016 –461 –460 –461
2.875% US dollar 600 million bond due March 2016 –395 –416 –394
5.75% US dollar 750 million bond due March 2016 –494 –561 –536
4.75% euro 500 million bond due June 2016 302 422 328 474 441 455
5.625% US dollar 1,300 million bond due February 2017 –856 –995 –937
1.625% US dollar 1,000 million bond due March 2017 –658 –665 –655
6.5% euro 400 million bond due July 2017 330 –351 –347 –
1.25% US dollar 1,000 million bond due September 2017 –658 –654 –655
5.375% sterling 600 million bond due December 2017 548 552 611 646 569 571
1.5% US dollar 1,400 million bond due February 2018 –921 –922 –917
5% euro 750 million bond due June 2018 619 633 716 750 644 658
6.5% euro 700 million bond due June 2018 578 –604 –606 –
4.625% US dollar 500 million bond due July 2018 –329 –376 –387
8.125% sterling 450 million bond due November 2018 450 450 558 598 480 483
4.375% US dollar 500 million bond due March 2021 –329 –371 –327
7.875% US dollar 750 million bond due February 2030 –494 –699 –778
6.25% US dollar 495 million bond due November 2032 –326 –399 –442
6.15% US dollar 1,700 million bond due February 2037 –1,119 –1,313 –1,566
Bonds in designated hedge relationships: 10,951 6,287 11,797 6,969 12,232 7,021
2.15% Japanese yen 3,000 million bond due April 2015 17 21 18 22 18 21
5.375% US dollar 900 million bond due January 2015 –592 –641 –633
US dollar oating rate note due February 2016 420 –420 –420 –
5.625% US dollar 1,300 million bond due February 2017 779 – 874 – 836 –
1.625% US dollar 1,000 million bond due March 2017 599 – 607 – 597 –
1.25% US dollar 1,000 million bond due September 2017 599 –594 –597 –
1.5% US dollar 1,400 million bond due February 2018 839 –827 –837 –
4.625% US dollar 500 million bond due July 2018 300 –332 –343 –
5.45% US dollar 1,250 million bond due June 2019 749 823 859 980 833 957
4.375% US dollar 500 million bond due March 2021 300 –322 –296 –
4.65% euro 1,250 million bond due January 2022 1,032 1,055 1,213 1,270 1,194 1,236
5.375% euro 500 million bond due June 2022 413 422 509 530 536 558
2.5% US dollar 1,000 million bond due September 2022 599 658 551 633 557 643
2.95% US dollar 1,600 million bond due February 2023 959 1,053 903 1,050 939 1,054
5.625% sterling 250 million bond due December 2025 250 250 284 308 313 338
6.6324% euro 50 million bond due December 2028 41 42 93 94 81 77
7.875% US dollar 750 million bond due February 2030 450 –603 –698 –
5.9% sterling 450 million bond due November 2032 450 450 519 560 561 598
6.25% US dollar 495 million bond due November 2032 297 –341 –399 –
6.15% US dollar 1,700 million bond due February 2037 1,019 –1,166 –1,416 –
4.375% US dollar 1,400 million bond due February 2043 839 921 762 881 761 906
Long-term borrowings 20,121 25,577 21,234 27,918 21,454 27,904
Notes to the consolidated nancial statements (continued)
Vodafone Group Plc
Annual Report 2014140


