Vodafone 2014 Annual Report Download - page 204
Download and view the complete annual report
Please find page 204 of the 2014 Vodafone annual report below. You can navigate through the pages in the report by either clicking on the pages listed below, or by using the keyword search tool below to find specific information within the annual report.-
 1
1 -
2
-
3
-
4
-
5
-
6
-
7
-
8
-
9
-
10
-
11
-
12
-
13
-
14
-
15
-
16
-
17
-
18
-
19
-
20
-
21
-
22
-
23
-
24
-
25
-
26
-
27
-
28
-
29
-
30
-
31
-
32
-
33
-
34
-
35
-
36
-
37
-
38
-
39
-
40
-
41
-
42
-
43
-
44
-
45
-
46
-
47
-
48
-
49
-
50
-
51
-
52
-
53
-
54
-
55
-
56
-
57
-
58
-
59
-
60
-
61
-
62
-
63
-
64
-
65
-
66
-
67
-
68
-
69
-
70
-
71
-
72
-
73
-
74
-
75
-
76
-
77
-
78
-
79
-
80
-
81
-
82
-
83
-
84
-
85
-
86
-
87
-
88
-
89
-
90
-
91
-
92
-
93
-
94
-
95
-
96
-
97
-
98
-
99
-
100
-
101
-
102
-
103
-
104
-
105
-
106
-
107
-
108
-
109
-
110
-
111
-
112
-
113
-
114
-
115
-
116
-
117
-
118
-
119
-
120
-
121
-
122
-
123
-
124
-
125
-
126
-
127
-
128
-
129
-
130
-
131
-
132
-
133
-
134
-
135
-
136
-
137
-
138
-
139
-
140
-
141
-
142
-
143
-
144
-
145
-
146
-
147
-
148
-
149
-
150
-
151
-
152
-
153
-
154
-
155
-
156
-
157
-
158
-
159
-
160
-
161
-
162
-
163
-
164
-
165
-
166
-
167
-
168
-
169
-
170
-
171
-
172
-
173
-
174
-
175
-
176
-
177
-
178
-
179
-
180
-
181
-
182
-
183
-
184
-
185
-
186
-
187
-
188
-
189
-
190
-
191
-
192
-
193
-
 194
194 -
 195
195 -
 196
196 -
 197
197 -
 198
198 -
 199
199 -
 200
200 -
 201
201 -
 202
202 -
 203
203 -
 204
204 -
 205
205 -
 206
206 -
 207
207 -
 208
208 -
 209
209 -
 210
210 -
 211
211 -
 212
212 -
 213
213 -
 214
214 -
215
-
216
 |
 |

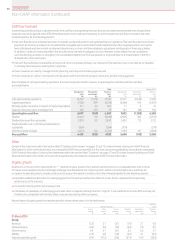
Cash ow measures
In presenting and discussing our reported results, free cash ow and operating free cash ow are calculated and presented even though these
measures are not recognised within IFRS. We believe that it is both useful and necessary to communicate free cash ow to investors and other
interested parties, for the following reasons:
a free cash ow allows us and external parties to evaluate our liquidity and the cash generated by our operations. Free cash ow does not include
payments for licences and spectrum included within intangible assets, items determined independently of the ongoing business, such as the
level of dividends, and items which are deemed discretionary, such as cash ows relating to acquisitions and disposals or nancing activities.
Inaddition, it does not necessarily reect the amounts which we have an obligation to incur. However, it does reect the cash available for
such discretionary activities, to strengthen the consolidated statement of nancial position or to provide returns to shareholders in the form
of dividends or share purchases;
a free cash ow facilitates comparability of results with other companies although our measure of free cash ow may not be directly comparable
tosimilarly titled measures used by other companies;
a these measures are used by management for planning, reporting and incentive purposes; and
a these measures are useful in connection with discussion with the investment analyst community and debt rating agencies.
A reconciliation of cash generated by operations, the closest equivalent GAAP measure, to operating free cash ow and free cash ow,
is provided below.
2014 Restated 2013
Management
basis
Presentation
adjustments
Statutory
basis
Management
basis
Presentation
adjustments
Statutory
basis
£m £m £m £m £m £m
Cash generated by operations 13,462 (1,315) 12,147 13,727 (2,234) 11,493
Capital expenditure (7,102) 789 (6,313) (6,266) 974 (5,292)
Working capital movement in respect of capital expenditure 411 45 456 71 374
Disposal of property, plant and equipment 106 (27) 79 153 (48) 105
Operating free cash ow 6,877 (508) 6,369 7,685 (1,305) 6,380
Taxation (3,547) 98 (3,449) (2,933) 363 (2,570)
Dividends received from associates 2,810 32 2,842 2,420 712 3,132
Dividends paid to non-controlling shareholders in
subsidiaries (264) –(264) (379) –(379)
Interest received and paid (1,471) 156 (1,315) (1,185) 127 (1,058)
Free cash ow 4,405 (222) 4,183 5,608 (103) 5,505
Other
Certain of the statements within the section titled “Chief Executive’s review” on pages 12 and 13 contain forward-looking non-GAAP nancial
information for which at this time there is no comparable GAAP measure and which at this time cannot be quantitatively reconciled to comparable
GAAP nancial information. Certain of the statements within the section titled “Guidance” on pages 13 and 39 contain forward-looking non-GAAP
nancial information which at this time cannot be quantitatively reconciled to comparable GAAP nancial information.
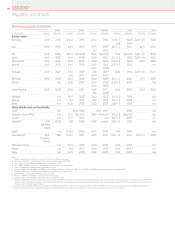
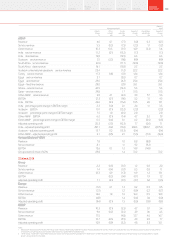
Organic growth
All amounts in this document marked with an “*” represent organic growth which presents performance on a comparable basis, both in terms
ofmerger and acquisition activity and foreign exchange rates. We believe that “organic growth”, which is not intended to be a substitute for
or superior to reported growth, provides useful and necessary information to investors and other interested parties for the following reasons:
a it provides additional information on underlying growth of the business without the effect of certain factors unrelated to the operating
performance of the business;
a it is used for internal performance analysis; and
a it facilitates comparability of underlying growth with other companies, although the term “organic” is not a dened term under IFRS and may not,
therefore, be comparable with similarly titled measures reported by other companies.
Reconciliation of organic growth to reported growth is shown where used, or in the table below:
Management basis1
Statutory
basis1
Organic
change
%
Other
activity2
pps
Foreign
exchange
pps
Reported
change
%
Presentation
adjustments
pps
Reported
change
%
31 March 2014
Group
Revenue (3.5) 3.7 (2.1) (1.9) 2.7 0.8
Service revenue (4.3) 3.8 (1.9) (2.4) 2.9 0.5
Other revenue 4.9 2.7 (4.1) 3.5 0.2 3.7
EBITDA (7.4) 3.8 (1.8) (5.4) 2.1 (3.3)
Adjusted operating prot (9.4) (27.2) (0.8) (37.4) 14.5 (22.9)
Vodafone Group Plc
Annual Report 2014202
Non-GAAP information (continued)