Vodafone 2014 Annual Report Download - page 5
Download and view the complete annual report
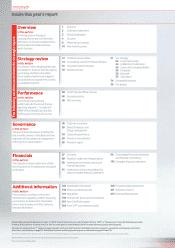
Please find page 5 of the 2014 Vodafone annual report below. You can navigate through the pages in the report by either clicking on the pages listed below, or by using the keyword search tool below to find specific information within the annual report.-
 1
1 -
 2
2 -
 3
3 -
 4
4 -
 5
5 -
 6
6 -
 7
7 -
 8
8 -
 9
9 -
 10
10 -
 11
11 -
 12
12 -
 13
13 -
 14
14 -
 15
15 -
 16
16 -
17
-
18
-
19
-
20
-
21
-
22
-
23
-
24
-
25
-
26
-
27
-
28
-
29
-
30
-
31
-
32
-
33
-
34
-
35
-
36
-
37
-
38
-
39
-
40
-
41
-
42
-
43
-
44
-
45
-
46
-
47
-
48
-
49
-
50
-
51
-
52
-
53
-
54
-
55
-
56
-
57
-
58
-
59
-
60
-
61
-
62
-
63
-
64
-
65
-
66
-
67
-
68
-
69
-
70
-
71
-
72
-
73
-
74
-
75
-
76
-
77
-
78
-
79
-
80
-
81
-
82
-
83
-
84
-
85
-
86
-
87
-
88
-
89
-
90
-
91
-
92
-
93
-
94
-
95
-
96
-
97
-
98
-
99
-
100
-
101
-
102
-
103
-
104
-
105
-
106
-
107
-
108
-
109
-
110
-
111
-
112
-
113
-
114
-
115
-
116
-
117
-
118
-
119
-
120
-
121
-
122
-
123
-
124
-
125
-
126
-
127
-
128
-
129
-
130
-
131
-
132
-
133
-
134
-
135
-
136
-
137
-
138
-
139
-
140
-
141
-
142
-
143
-
144
-
145
-
146
-
147
-
148
-
149
-
150
-
151
-
152
-
153
-
154
-
155
-
156
-
157
-
158
-
159
-
160
-
161
-
162
-
163
-
164
-
165
-
166
-
167
-
168
-
169
-
170
-
171
-
172
-
173
-
174
-
175
-
176
-
177
-
178
-
179
-
180
-
181
-
182
-
183
-
184
-
185
-
186
-
187
-
188
-
189
-
190
-
191
-
192
-
193
-
194
-
195
-
196
-
197
-
198
-
199
-
200
-
201
-
202
-
203
-
204
-
205
-
206
-
207
-
208
-
209
-
210
-
211
-
212
-
213
-
214
-
215
-
216
 |
 |

Financial highlights
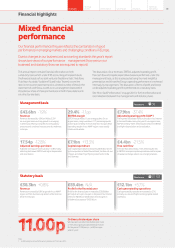
Mixed nancial
performance
Our nancial performance this year reects the combination of good
performance in emerging markets and challenging conditions in Europe.
Due to changes in our business and accounting standards this year’s report
shows two views of our performance – management (how we run our
business) and statutory (how we are required to report).
Note:
1 Vodafone Italy became a 100% owned subsidiary on 21 February 2014.
Management basis
£43.6bn -1.9%
Revenue
Revenue decreased by 1.9% and fell by 3.5%*
on an organic basis as strong growth in emerging
markets was offset by competitive and regulatory
pressures and continued macroeconomic weakness
in Europe.
17.54p -12.8%
Adjusted earnings per share
Adjusted earnings per share was down 12.8% mainly
reecting both lower EBITDA and higher depreciation
and amortisation.
29.4% -1.1pp
EBITDA margin
EBITDA margin fell by 1.1 percentage points. On an
organic basis, margin was down 1.3* percentage points
as the impact of steep revenue declines in Europe offset
improving margins in our AMAP region, most notably
in India and Australia.
£7.1bn +13.3%
Capital expenditure
Cash capital expenditure increased by £0.8 billion driven
by the acquisition of Kabel Deutschland, the bre roll-out
in Spain, and initial Project Spring investment in India
and Germany.
£7.9bn -37.4%
Adjusted operating prot (‘AOP’)
The reported fall relates mainly to the sale of our interest
in Verizon Wireless during the year. On an organic basis,
AOP declined by 9.4%*, reecting the decline in EBITDA
and higher depreciation and amortisation.
£4.4bn -21.5%
Free cash ow
Free cash ow declined by 21.5%, reecting the fall
in EBITDA, increased capital expenditure and the impact
of weaker exchange rates in our emerging markets.
Read more 38
Statutory basis
£38.3bn +0.8%
Revenue
Revenues increased by 0.8% as growth in our AMAP
region and from business acquisitions offset revenue
declines in Europe.
£59.4bn N/A
Prot for the nancial year
Prot for the nancial year increased by £58.8 billion
primarily due to a pre-tax gain on disposal of our interest
in Verizon Wireless of £45.0 billion and recognition
of deferred tax assets of £19.3 billion.
£12.1bn +5.7%
Cash generated by operations
Cash generated by operations increased by 5.7%,
primarily as a result of higher working capital related
cash ows.
Read more 97, 103
This annual report contains nancial information on both
a statutorybasis, which under IFRS accounting principles include
the nancial results of our joint ventures (Vodafone Italy1, Vodafone
Hutchison Australia, Vodafone Fiji and Indus Towers) as one line
item in the incomestatement and in a limited number of lines in the
statement of cash ows, as well as on a management basis which
includes our share of these joint ventures in both these statements
on a line-by-line basis.
The discussion of our revenues, EBITDA, adjusted operating prot,
free cash ow and capital expenditure below is performed under the
management basis, as this is assessed as being the most insightful
presentation and is how the Group’s operating performance is reviewed
internally by management. The discussion of items of prot and losses
under adjusted operating prot is performed on a statutory basis.
See “Non-GAAP information” on page 201 for further information and
reconciliations between the management and statutory basis.
Ordinary dividend per share
We have announced a nal dividend per share
of 7.47pence, giving total dividends per share
for the year of 11.00 pence – an 8% increase
year-on-year.
03Overview Strategy
review Performance Governance Financials Additional
information