Vodafone 2014 Annual Report Download - page 203
Download and view the complete annual report
Please find page 203 of the 2014 Vodafone annual report below. You can navigate through the pages in the report by either clicking on the pages listed below, or by using the keyword search tool below to find specific information within the annual report.-
 1
1 -
2
-
3
-
4
-
5
-
6
-
7
-
8
-
9
-
10
-
11
-
12
-
13
-
14
-
15
-
16
-
17
-
18
-
19
-
20
-
21
-
22
-
23
-
24
-
25
-
26
-
27
-
28
-
29
-
30
-
31
-
32
-
33
-
34
-
35
-
36
-
37
-
38
-
39
-
40
-
41
-
42
-
43
-
44
-
45
-
46
-
47
-
48
-
49
-
50
-
51
-
52
-
53
-
54
-
55
-
56
-
57
-
58
-
59
-
60
-
61
-
62
-
63
-
64
-
65
-
66
-
67
-
68
-
69
-
70
-
71
-
72
-
73
-
74
-
75
-
76
-
77
-
78
-
79
-
80
-
81
-
82
-
83
-
84
-
85
-
86
-
87
-
88
-
89
-
90
-
91
-
92
-
93
-
94
-
95
-
96
-
97
-
98
-
99
-
100
-
101
-
102
-
103
-
104
-
105
-
106
-
107
-
108
-
109
-
110
-
111
-
112
-
113
-
114
-
115
-
116
-
117
-
118
-
119
-
120
-
121
-
122
-
123
-
124
-
125
-
126
-
127
-
128
-
129
-
130
-
131
-
132
-
133
-
134
-
135
-
136
-
137
-
138
-
139
-
140
-
141
-
142
-
143
-
144
-
145
-
146
-
147
-
148
-
149
-
150
-
151
-
152
-
153
-
154
-
155
-
156
-
157
-
158
-
159
-
160
-
161
-
162
-
163
-
164
-
165
-
166
-
167
-
168
-
169
-
170
-
171
-
172
-
173
-
174
-
175
-
176
-
177
-
178
-
179
-
180
-
181
-
182
-
183
-
184
-
185
-
186
-
187
-
188
-
189
-
190
-
191
-
192
-
 193
193 -
 194
194 -
 195
195 -
 196
196 -
 197
197 -
 198
198 -
 199
199 -
 200
200 -
 201
201 -
 202
202 -
 203
203 -
 204
204 -
 205
205 -
 206
206 -
 207
207 -
 208
208 -
 209
209 -
 210
210 -
 211
211 -
 212
212 -
 213
213 -
214
-
215
-
216
 |
 |

In the discussion of our reported nancial position, operating results and cash ows, information is presented to provide readers with additional
nancial information that is regularly reviewed by management. However, this additional information presented is not uniformly dened by all
companies including those in the Group’s industry. Accordingly, it may not be comparable with similarly titled measures and disclosures by other
companies. Additionally, certain information presented is derived from amounts calculated in accordance with IFRS but is not itself an expressly
permitted GAAP measure. Such non-GAAP measures should not be viewed in isolation or as an alternative to the equivalent GAAP measure.
Management basis
The discussion of our operating results and cash ows in the strategic report is shown on a management basis, consistent with how the business
is managed, operated and reviewed by management, and includes the results of the Group’s joint ventures, Vodafone Italy, Vodafone Hutchison
Australia, Vodafone Fiji and Indus Towers, on a proportionate basis. This differs to the “Consolidated nancial statements” on pages 96 to 170 which
are presented on a statutory basis, and includes the results of the Group’s joint ventures using the equity accounting basis.
We believe that the management basis metrics, which are not intended to be a substitute for, or superior to, our reported metrics, provide useful
and necessary information to investors and other interested parties as they are used internally for performance analysis and resource allocation
purposes of the operations where we have control or joint control. A reconciliation of the key operating metrics on a management basis to the
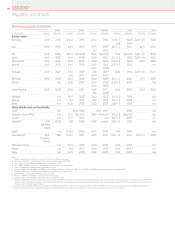
statutory results are summarised below and provided in detail in note 2 “Segmental analysis” to the consolidated nancial statements.
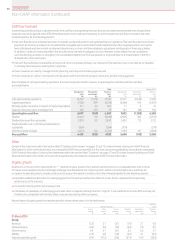
2014 Restated 2013
Management
basis
Presentation
adjustments
Discontinued
operations
Statutory
basis
Management
basis
Presentation
adjustments
Discontinued
operations
Statutory
basis
£m £m £m £m £m £m £m £m
Revenue 43,616 (5,270) –38,346 44,445 (6,404) –38,041
EBITDA 12,831 (1,747) –11,084 13,566 (2,100) –11,466
Depreciation and amortisation (8,181) 1,083 –(7,098) (7,543) 1,041 –(6,502)
Share of results in associates and joint ventures 3,224 269 (3,169) 324 6,554 572 (6,500) 626
Adjusted operating prot 7,874 (395) (3,169) 4,310 12,577 (487) (6,500) 5,590
Impairment loss (6,600) (7,700)
Restructuring costs (355) (311)
Amortisation of acquired customer base and
brand intangible assets (551) (249)
Other income and expense (717) 468
Operating loss (3,913) (2,202)
Non-operating income and expense (149) 10
Investment income and nancing costs (1,208) (1,291)
Income tax credit/(expense) 16,582 (476)
Prot for the nancial year from discontinued
activities 48,108 4,616
Prot for the nancial year 59,420 657
EBITDA
EBITDA is operating prot excluding share in results of associates, depreciation and amortisation, gains/losses on the disposal of xed assets,
impairment losses, restructuring costs, other operating income and expense and signicant items that are not considered by management
to be reective of the underlying performance of the Group. We use EBITDA, in conjunction with other GAAP and non-GAAP nancial measures
such as adjusted operating prot, operating prot and net prot, to assess our operating performance. We believe that EBITDA is an operating
performance measure, not a liquidity measure, as it includes non-cash changes in working capital and is reviewed by the Chief Executive to assess
internal performance in conjunction with EBITDA margin, which is an alternative sales margin gure. We believe it is both useful and necessary
to report EBITDA as a performance measure as it enhances the comparability of prot across segments.
Because EBITDA does not take into account certain items that affect operations and performance, EBITDA has inherent limitations as a performance
measure. To compensate for these limitations, we analyse EBITDA in conjunction with other GAAP and non-GAAP operating performance measures.
EBITDA should not be considered in isolation or as a substitute for a GAAP measure of operating performance. A reconciliation of EBITDA to the
closest equivalent GAAP measure, operating prot, is provided in above and in note 2 “Segmental analysis” to the consolidated nancial statements.
Group adjusted operating prot and adjusted earnings per share
Group adjusted operating prot excludes non-operating income of associates, impairment losses, restructuring costs, amortisation of customer
bases and brand intangible assets, other operating income and expense and other signicant one-off items. Adjusted earnings per share also
excludes certain foreign exchange rate differences, together with related tax effects. We believe that it is both useful and necessary to report these
measures for the following reasons:
a these measures are used for internal performance reporting;
a these measures are used in setting director and management remuneration; and
a they are useful in connection with discussion with the investment analyst community and debt rating agencies.
A reconciliation of adjusted operating prot to the respective closest equivalent GAAP measure, operating prot, is provided above and in note 2
“Segmental analysis” to the consolidated nancial statements. A reconciliation of adjusted earnings per share to basic earnings per share, is provided
in the “Operating Review” on page 45.
201Overview Strategy
review Performance Governance Financials Additional
information
Non-GAAP information