Vodafone 2014 Annual Report Download - page 176
Download and view the complete annual report
Please find page 176 of the 2014 Vodafone annual report below. You can navigate through the pages in the report by either clicking on the pages listed below, or by using the keyword search tool below to find specific information within the annual report.-
 1
1 -
2
-
3
-
4
-
5
-
6
-
7
-
8
-
9
-
10
-
11
-
12
-
13
-
14
-
15
-
16
-
17
-
18
-
19
-
20
-
21
-
22
-
23
-
24
-
25
-
26
-
27
-
28
-
29
-
30
-
31
-
32
-
33
-
34
-
35
-
36
-
37
-
38
-
39
-
40
-
41
-
42
-
43
-
44
-
45
-
46
-
47
-
48
-
49
-
50
-
51
-
52
-
53
-
54
-
55
-
56
-
57
-
58
-
59
-
60
-
61
-
62
-
63
-
64
-
65
-
66
-
67
-
68
-
69
-
70
-
71
-
72
-
73
-
74
-
75
-
76
-
77
-
78
-
79
-
80
-
81
-
82
-
83
-
84
-
85
-
86
-
87
-
88
-
89
-
90
-
91
-
92
-
93
-
94
-
95
-
96
-
97
-
98
-
99
-
100
-
101
-
102
-
103
-
104
-
105
-
106
-
107
-
108
-
109
-
110
-
111
-
112
-
113
-
114
-
115
-
116
-
117
-
118
-
119
-
120
-
121
-
122
-
123
-
124
-
125
-
126
-
127
-
128
-
129
-
130
-
131
-
132
-
133
-
134
-
135
-
136
-
137
-
138
-
139
-
140
-
141
-
142
-
143
-
144
-
145
-
146
-
147
-
148
-
149
-
150
-
151
-
152
-
153
-
154
-
155
-
156
-
157
-
158
-
159
-
160
-
161
-
162
-
163
-
164
-
165
-
 166
166 -
 167
167 -
 168
168 -
 169
169 -
 170
170 -
 171
171 -
 172
172 -
 173
173 -
 174
174 -
 175
175 -
 176
176 -
 177
177 -
 178
178 -
 179
179 -
 180
180 -
 181
181 -
 182
182 -
 183
183 -
 184
184 -
 185
185 -
 186
186 -
187
-
188
-
189
-
190
-
191
-
192
-
193
-
194
-
195
-
196
-
197
-
198
-
199
-
200
-
201
-
202
-
203
-
204
-
205
-
206
-
207
-
208
-
209
-
210
-
211
-
212
-
213
-
214
-
215
-
216
 |
 |

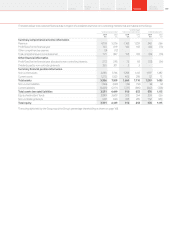
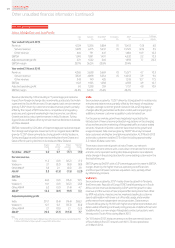
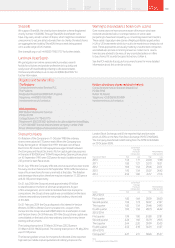
Prior year operating results (continued)
Africa, Middle East and Asia Pacic
India
£m
Vodacom
£m
Other AMAP
£m
Eliminations
£m
AMAP
£m
% change
£Organic
Year ended 31 March 2013
Revenue 4,324 5,206 5,884 (1) 15,413 (1.0) 6.0
Service revenue 3,878 4,415 5,437 (1) 13,729 (2.3) 5.5
Other revenue 446 791 447 –1,684 10.9 10.3
EBITDA 1,240 1,891 1,401 –4,532 3.2 12. 3
Adjusted operating prot 221 1,332 340 –1,893 7.7 20.3
EBITDA margin 28.7% 36.3% 23.8% 29.4%
Year ended 31 March 2012
Revenue 4,265 5,638 5,669 (1) 15, 571 4.7 10.3
Service revenue 3,922 4,898 5,234 (1) 14,053 3.9 9.6
Other revenue 343 74 0 435 –1, 518 12.7 17. 5
EBITDA 1,12 2 1,933 1,338 –4,393 4.9 10.7
Adjusted operating prot 60 1,338 359 –1,757 4.8 10.9
EBITDA margin 26.3% 34.3% 23.6% 28.2%
Revenue declined by 1.0% including a 7.7 percentage point adverse
impact from foreign exchange rate movements, particularly the Indian
rupee and the South African rand. On an organic basis service revenue
grew by 5.5%* driven by customer and data revenue growth, partially
offset by the impact of MTR reductions, competitive and regulatory
pressures, and a general weakening in macroeconomic conditions.
Growth was led by robust performances in India, Vodacom, Turkey,
Egypt, Ghana and Qatar, offset by service revenue declines in Australia
and New Zealand.
EBITDA increased by 3.2% after a 9.0 percentage point adverse impact
from foreign exchange rate movements. On an organic basis, EBITDA
grew by 12.3%* driven primarily by strong growth in India, Vodacom,
Turkey and Egypt as well as improved contributions from Ghana and
Qatar, offset in part by declines in Australia and New Zealand.
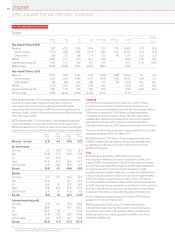
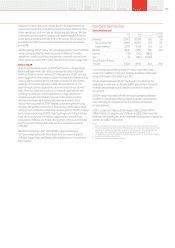
Organic
change
%
Other
activity1
pps
Foreign
exchange
pps
Reported
change
%
Revenue – AMAP 6.0 0.7 (7.7) (1.0)
Service revenue
India 11.2 (0.1) (12.2) (1.1)
Vodacom 3 .1 (3.2) (9.8) (9.9)
Other AMAP 3.8 2 .1 (2.0) 3.9
AMAP 5.5 (0.3) (7.5) (2.3)
EBITDA
India 24.0 (0.1) (13.4) 10.5
Vodacom 10.1 (0.1) (12.2) (2.2)
Other AMAP 6.2 (0.1) (1.4) 4.7
AMAP 12.3 (0.1) (9.0) 3.2
Adjusted operating prot
India 291.1 (3.4) (19.4) 268.3
Vodacom 12.7 0.2 (13.3) (0.4)
Other AMAP 2.1 (9.5) 2 .1 (5.3)
AMAP 20.3 (2.3) (10.3) 7.7
Note:
1 “Other activity” includes the impact of M&A activity and the revision to intra-group roaming charges from
1October 2011. Refer to “Organic growth” on page 202 for further detail.
India
Service revenue grew by 11.2%* driven by strong growth in mobile voice
minutes and data revenue, partially offset by the impact of regulatory
changes. Average customer growth slowed in Q4, as Q3 regulatory
changes affecting subscriber verication continued to impact gross
additions, however customer acquisition costs remained low.
For the year as a whole, growth was negatively impacted by the
introduction of new consumer protection regulations on the charging
of access fees and the marketing of integrated tariffs and value-added
services. However, in Q4 the customer base returned to growth and
usage increased. Data revenue grew by 19.8%* driven by increased
data customers and higher smartphone penetration. At 31 March 2013
active data customers totalled 37.3 million including approximately
3.3 million 3G data customers.
There was a lower rate of growth at Indus Towers, our network
infrastructure joint venture, with a slow down in tenancies from smaller
entrants, some operators exiting sites following licence cancellations
and a change in the pricing structure for some existing customers in the
rst half of the year.
EBITDA grew by 24.0%*, with a 3.3* percentage point increase in EBITDA
margin, driven by the higher revenue, operating cost efciencies
and the impact of lower customer acquisition costs, partially offset
by inationary pressure.
Vodacom
Service revenue grew by 3.1%* mainly driven by growth in Tanzania,
the Democratic Republic of Congo (‘DRC’) and Mozambique. In South
Africa, service revenue decreased by 0.3%*, with the growth in data
revenue and the success of new prepaid offers being more than offset
by MTR reductions, macroeconomic weakness leading to customer
spend optimisation with lower out-of-bundle usage, and a weaker
performance from independent service providers. Data revenue
in South Africa grew by 16.1%*, with higher smartphone penetration and
data bundles offsetting continued pricing pressure. Vodafone Smart and
Vodafone Red, our new range of integrated contract price plans, were
introduced in South Africa during March 2013.
On 10 October 2012, Vodacom announced the commercial launch
of South Africa’s rst LTE network, with 601 LTE sites operational
at 31 March 2013.
Vodafone Group Plc
Annual Report 2014174
Other unaudited nancial information (continued)