Vodafone 2014 Annual Report Download - page 20
Download and view the complete annual report
Please find page 20 of the 2014 Vodafone annual report below. You can navigate through the pages in the report by either clicking on the pages listed below, or by using the keyword search tool below to find specific information within the annual report.-
 1
1 -
2
-
3
-
4
-
5
-
6
-
7
-
8
-
9
-
 10
10 -
 11
11 -
 12
12 -
 13
13 -
 14
14 -
 15
15 -
 16
16 -
 17
17 -
 18
18 -
 19
19 -
 20
20 -
 21
21 -
 22
22 -
 23
23 -
 24
24 -
 25
25 -
 26
26 -
 27
27 -
 28
28 -
 29
29 -
 30
30 -
31
-
32
-
33
-
34
-
35
-
36
-
37
-
38
-
39
-
40
-
41
-
42
-
43
-
44
-
45
-
46
-
47
-
48
-
49
-
50
-
51
-
52
-
53
-
54
-
55
-
56
-
57
-
58
-
59
-
60
-
61
-
62
-
63
-
64
-
65
-
66
-
67
-
68
-
69
-
70
-
71
-
72
-
73
-
74
-
75
-
76
-
77
-
78
-
79
-
80
-
81
-
82
-
83
-
84
-
85
-
86
-
87
-
88
-
89
-
90
-
91
-
92
-
93
-
94
-
95
-
96
-
97
-
98
-
99
-
100
-
101
-
102
-
103
-
104
-
105
-
106
-
107
-
108
-
109
-
110
-
111
-
112
-
113
-
114
-
115
-
116
-
117
-
118
-
119
-
120
-
121
-
122
-
123
-
124
-
125
-
126
-
127
-
128
-
129
-
130
-
131
-
132
-
133
-
134
-
135
-
136
-
137
-
138
-
139
-
140
-
141
-
142
-
143
-
144
-
145
-
146
-
147
-
148
-
149
-
150
-
151
-
152
-
153
-
154
-
155
-
156
-
157
-
158
-
159
-
160
-
161
-
162
-
163
-
164
-
165
-
166
-
167
-
168
-
169
-
170
-
171
-
172
-
173
-
174
-
175
-
176
-
177
-
178
-
179
-
180
-
181
-
182
-
183
-
184
-
185
-
186
-
187
-
188
-
189
-
190
-
191
-
192
-
193
-
194
-
195
-
196
-
197
-
198
-
199
-
200
-
201
-
202
-
203
-
204
-
205
-
206
-
207
-
208
-
209
-
210
-
211
-
212
-
213
-
214
-
215
-
216
 |
 |

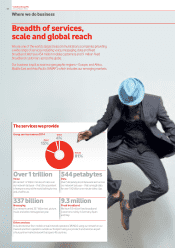
Market overview
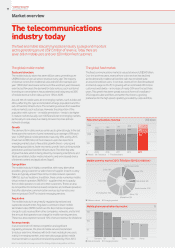
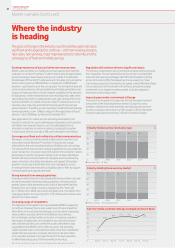
Mobile users by market 2013: 7.0 billion (2012: 6.4 billion)
Europe: 17%
North America: 6%
Mature Asia: 4%
Middle East: 5%
South America: 10%
Africa: 11%
Emerging Asia: 15%
India: 14%
China: 18%
n Mature markets n Emerging markets
n Mature markets n Emerging markets
n Mobile n Fixed voice n Fixed broadband
Germany
141
UK US Turkey India Kenya
138
112
93
78 74
0
50
100
150
Mobile phone penetration by market %
The telecommunications
industry today
The xed and mobile telecommunications industry is a large and important
sector, generating around US$1.5 trillion of revenue. Today there are
sevenbillion mobile users and over 650 million xed customers.
The global mobile market
Scale and structure
The mobile industry alone has seven billion users, generating over
US$960billion of annual service revenue every year. The majority
of revenue comes from traditional calls and texts (for example, last
year 7,800 billion texts were sent around the world last year). However,
over the last few years the demand for data services, such as internet
browsing on a smartphone, has accelerated, and today around 28%
of mobile revenue is from data, up from 13% in 2009.
Around 74% of mobile users are in emerging markets, such as India and
Africa, reecting the typical combination of large populations and the
lack of xed line infrastructure. The remaining users are from wealthier
mature markets, such as Europe. However, the proportion of the
population with a phone – or mobile penetration – tends to be higher
in mature markets (usually over 100%) and lower in emerging markets,
particularly in rural areas, due mainly to lower incomes and less
network coverage.
Growth
The demand for mobile services continues to grow strongly. In the last
three years the number of users increased by an average of 9% each
year. In 2009 global mobile penetration was only 69%, and by 2013
it had risen to 98%. Most of the increase in users has been from
emerging markets due to favourable growth drivers – young and
expanding populations, fastereconomic growth, low but rising mobile
penetration, and less xed line infrastructure. The other key area
of growth is data, which is being driven by increasing smartphone and
tablet penetration, better mobile networks, and an increased choice
of internet content and applications (‘apps’).
Competition
The mobile industry is highly competitive, with many alternative
providers, giving customers a wide choice of supplier. In each country
there are typically at least three to four mobile network operators
(‘MNOs’), such as Vodafone. In addition, there can be numerous mobile
virtual network operators (‘MVNOs’) – suppliers that rent capacity
from mobile operators to sell on to their customers. There can also
be competition from internet-based companies and software providers
that offer alternative communication services such as voice over
internet protocol (‘VoIP’) or instant messaging services.
Regulation
The mobile industry is very heavily regulated by national and
supranational authorities. Regulators continue to lower mobile
termination rates (‘MTRs’) which are the fees mobile companies
charge for calls received from other companies’ networks, and to limit
the amount that operators can charge for mobile roaming services.
These two areas represent around 12% of service revenue for Vodafone.
Revenue trends
In an environment of intense competition and signicant
regulatorypressures, the price of mobile services has tended
to reduceover time. However, with both more mobile phone users,
mainly in emerging markets, and more data usage, global mobile
revenue remains on a positive trend and expanded by 2% in 2013.
The global xed market
The xed communications market is valued at around US$500 billion.
Over the last three years, revenue from voice services has declined
as the demand for traditional xed line calls has remained static
at around one billion users. In contrast, revenue from xed broadband
or internet usage on the PC is growing with an estimated 650 million
customers worldwide – an increase of nearly 30% over the last three
years. This growth has been spread across all forms of broadband–
DSL (copper), cable and bre, and within this, there is a growing
preference for the high speed capability provided by cable and bre.
Note: The industry data on this page is sourced from Strategy Analytics, Analysys Mason and Ovum.
2009
822
362
170
862
340
184
902
319
197
940
298
209
963
277
217
2010 2011 2012 2013
0
500
1,000
1,500
Telecommunications revenue US$ billion
Vodafone Group Plc
Annual Report 2014
Vodafone Group Plc
Annual Report 20141818